mixed basic diagrams 1 mixed basic diagrams 3 mixed basic diagrams 2 mixed basic diagrams 4 mixed basic diagrams 5
Management Models

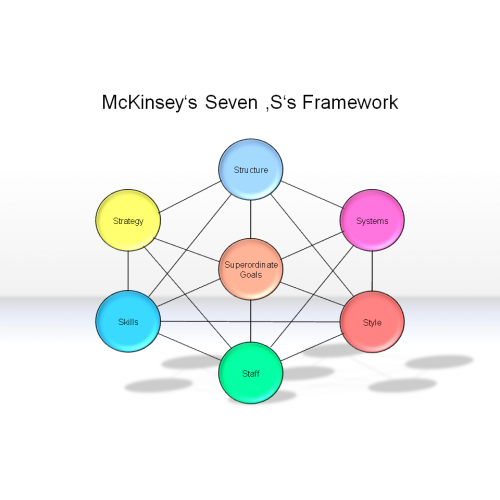
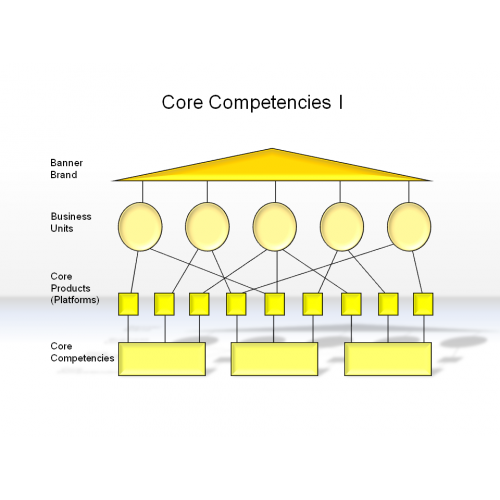
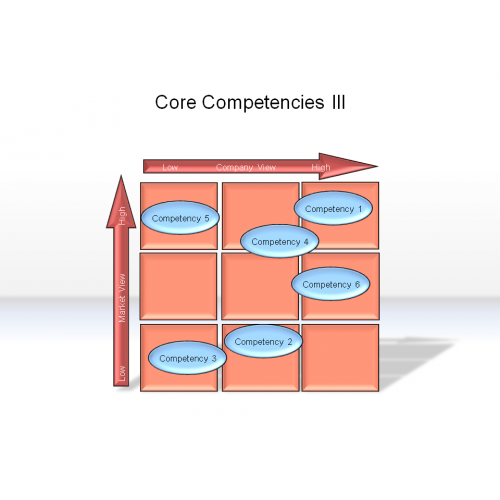
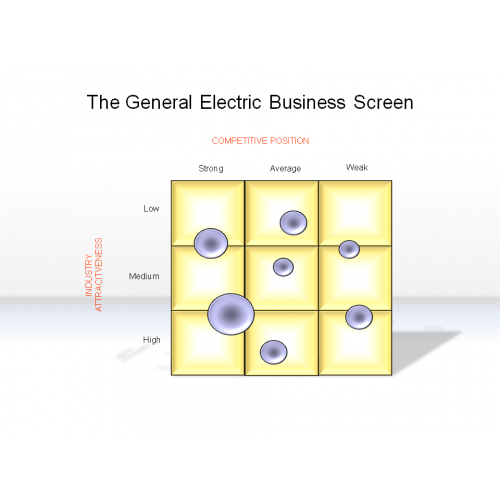
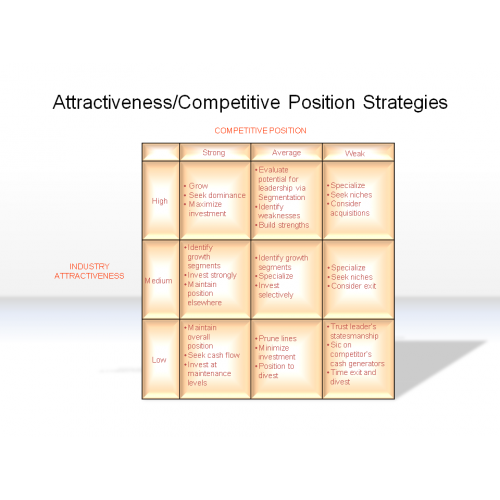
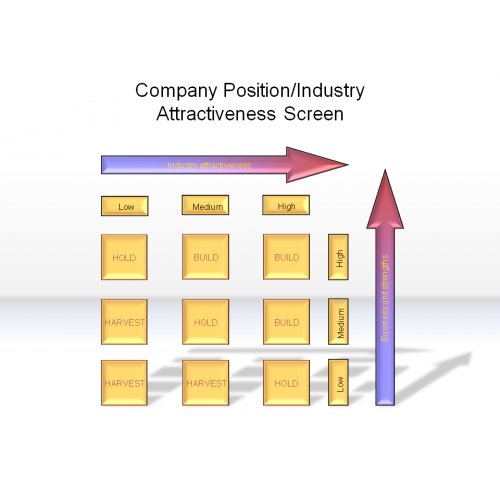
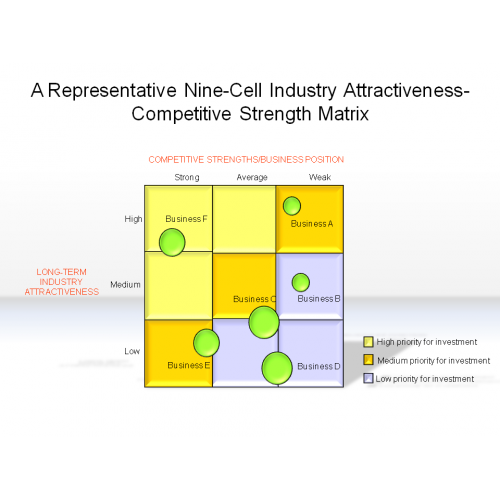
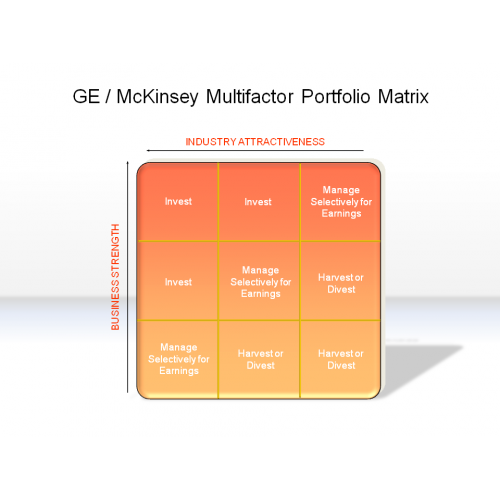
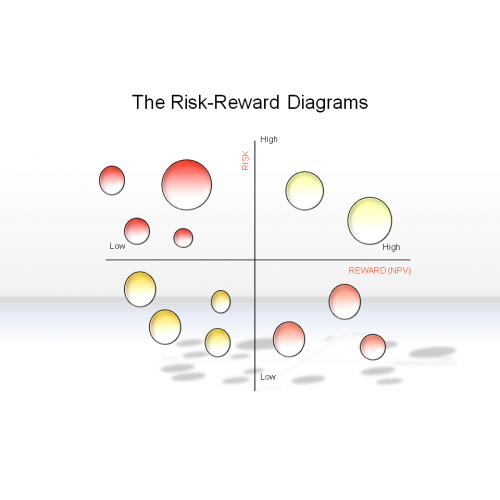
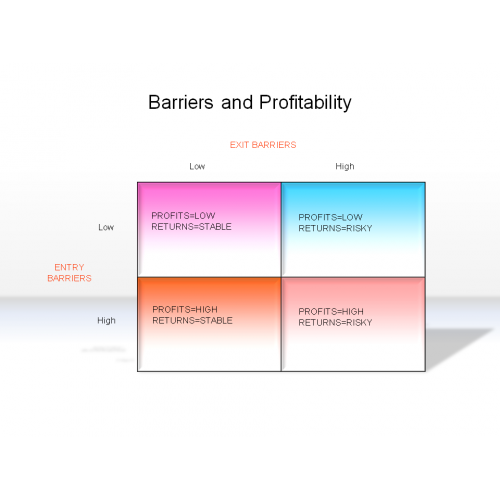
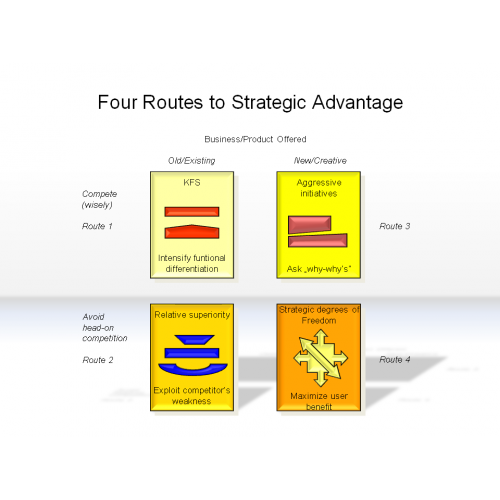
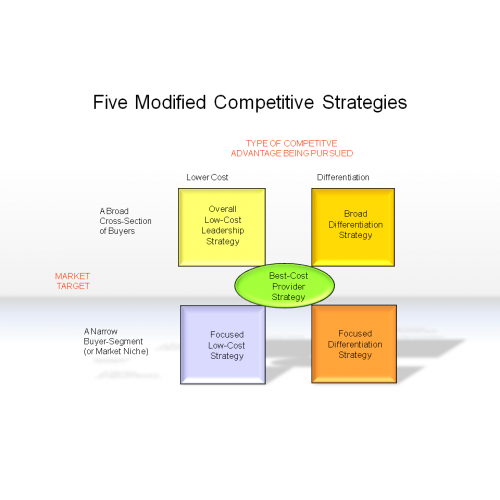
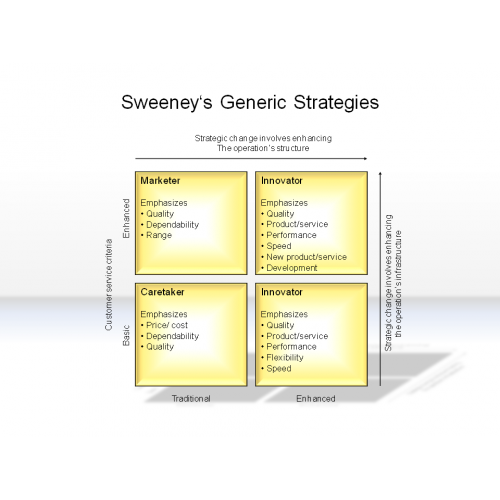
Product Life Cycle  -  Economies of Scale  -  Demand Elasticity  -  Life Cycle Portfolio Matrix  -  The Whole Product Model  -  The Product Positioning Map  -  Four P's of Mc Carthy  -  PDCA Cycle  -  SWOT Analysis  -  The Generic Value Chain  -  The Ansoff Matrix  -  BCG's Matrix  -  McKinsey 7-S Model  -  Core Competencies  -  General Electric Business Screen  -  The Risk-Reward Diagram  -  Porter's Five Forces  -  Barrriers of Profitability  -  The Generic Strategies  -  Sweeney's Generic Strategies  -  Porter's Diamond  -  PIMS Paradigm  -  The Strategic Triangle  -  Leavitt's Diamond  -  Maslow's Hierarchy of Human Needs  -  Herzberg's Motivator Theory  -  Managerial Grid  -  Cultural Web  -  Five Forces of Growth  -  The Chasm  -  Pareto Curve  -  ABC Analysis  -  CIM Concept  -  Total Quality Management  -  Supply Chain Management  -  CAPM  -  Variance Analysis  -  Du Pont Schema

McKinsey 7-S Framework
$3.00
Disruption and the New 7-S's
$3.00
Core Competencies I
Core Competencies I
$3.00
Core Competencies II
$3.00
Core Competencies III
$3.00
The General Electric Busiiness Screen
$3.00
Attractiveness/Competitive Position Strategies
$3.00
Company Position/Industry Attractiveness Screen
$3.00
A Representative Nine-Cell Industry Attractiveness-Competitive Strength Matrix
$3.00
GE / McKinsey Multifactor Portfolio Matrix
$3.00
Portfolio Positions and Defensive Strategic Market Plans
$3.00
Market Attractiveness - Portfolio Classification and Strategies
$3.00
The Risk-Reward Diagram
$3.00
Contrasting Characteristics of Upstream and Downstream Companies
$3.00
Porter's Five Forces I
$3.00
Porter's Five Forces II
$3.00
Forces Driving Industry Competition
$3.00
Barriers and Profitability
$3.00
Four Routes to Strategic Advantage
$3.00
The Generic Strategies I
$3.00
The Generic Strategies II
$3.00
Five Modified Competitive Strategies
$3.00
Sweeney's Generic Strategies
$3.00
Geobusiness Model
Geobusiness Model
$3.00