mixed basic diagrams 1 mixed basic diagrams 3 mixed basic diagrams 2 mixed basic diagrams 4 mixed basic diagrams 5
Strategic Management Models

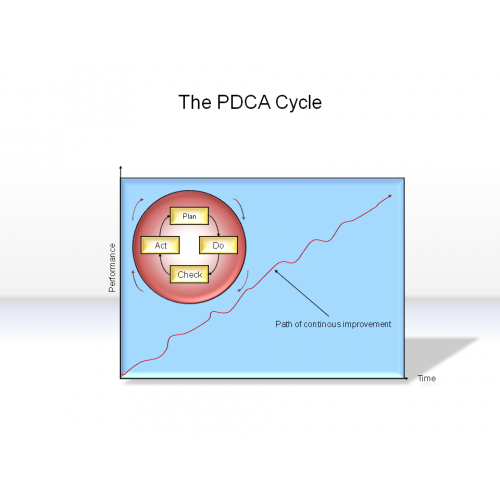
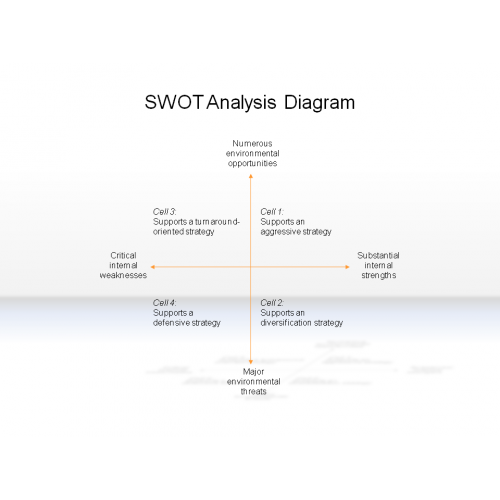
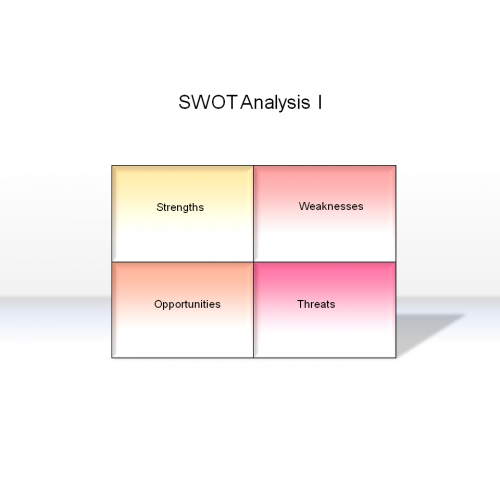
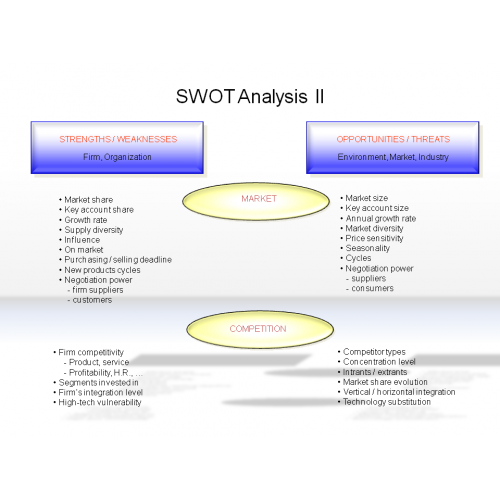
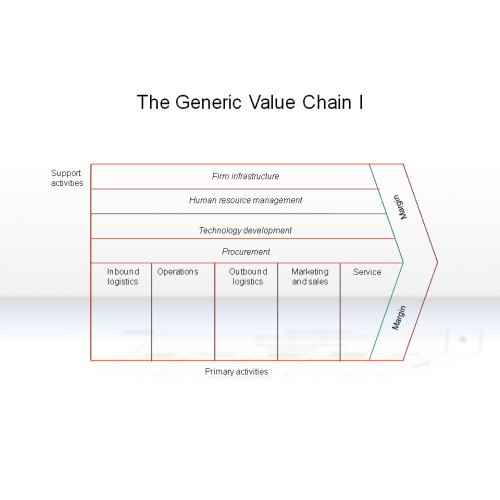
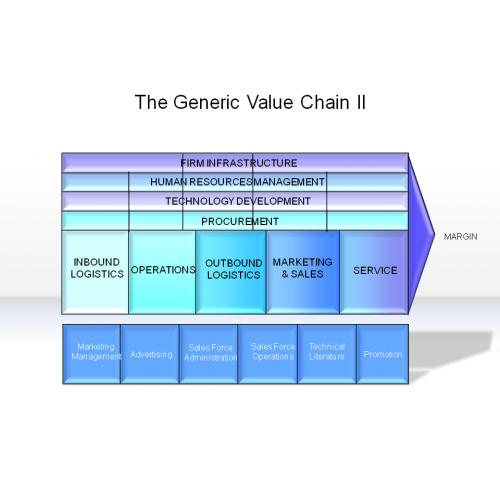
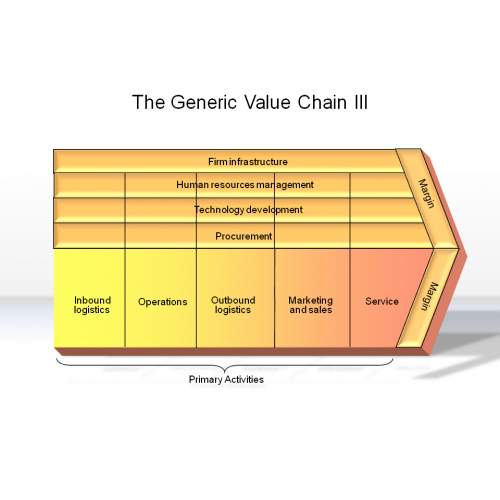
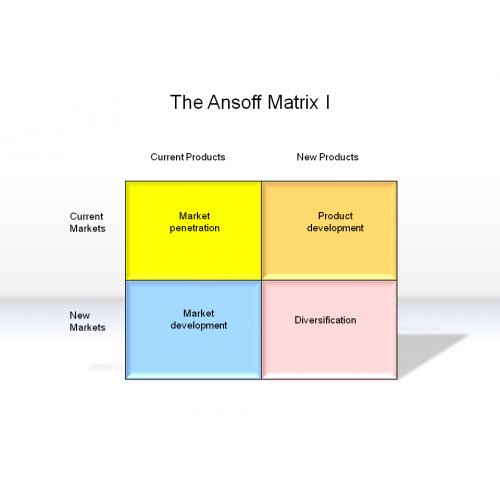
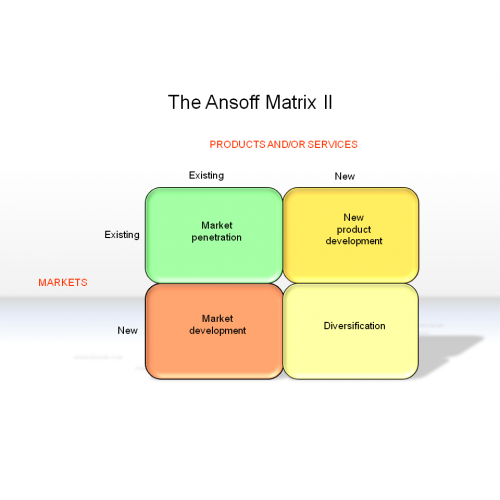
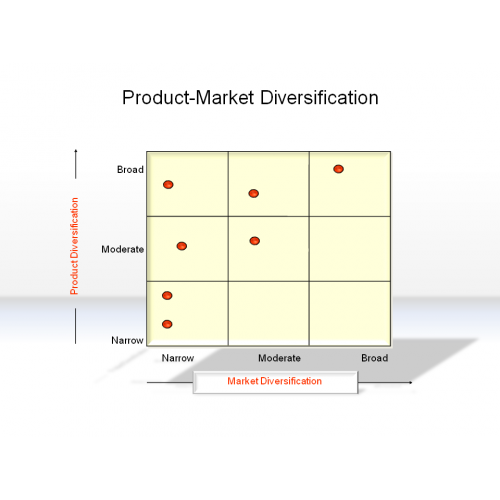
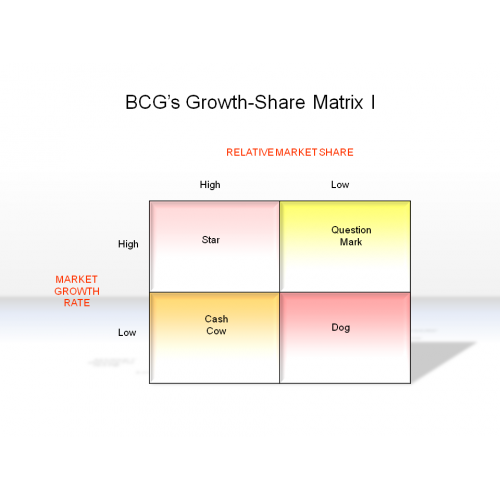
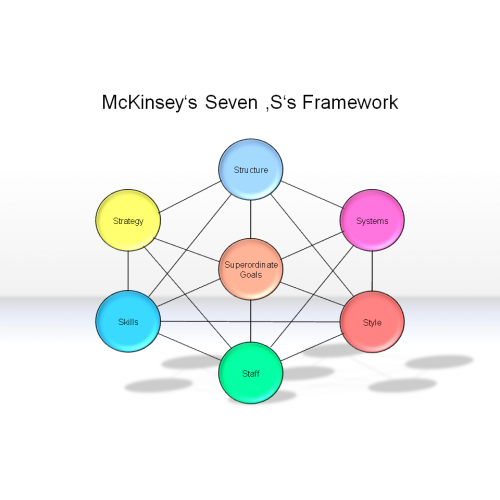
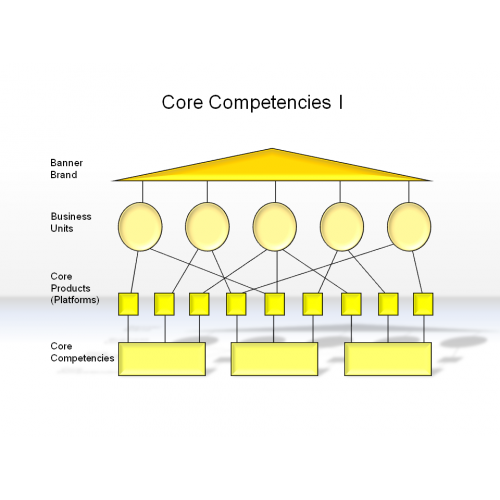
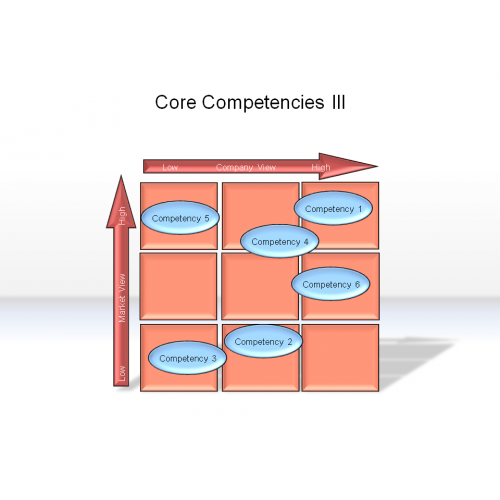
Das kulturelle Web  -  Anthony's Dreieck  -  Belbin's Teamrollen  -  Porter's Diamant  -  Stakeholder Mapping  -  Porter's fünf Wettbewerbskräfte  -  4 R der Business Transformation  -  Ansoff's Matrix  -  Boston-Box  -  Greiner's 5 Phasen  -  Kernkompetenzen  -  Kritische Erfolgsfaktoren  -  PEST  -  Porter's generische Strategien  -  Produktlebenszyklus  -  SWOT Analyse  -  Value Chain  -  Break even  -  Skaleneffekt  -  Nachfrageelastizitäten  -  Portfoliomatrix  -  4 P's von McCarthy  -  PDCA Zyklus  -  Wertekette  -  BCG Matrix  -  McKinsey's 7-S Modell  -  Porter's 5 Wettbewerbskräfte  -  Porter's Diamant  -  PIMS Paradigma  -  Strategisches Dreieck  -  Leavitt's Diamant  -  Maslow's Bedürfnispyramide  -  Herzberg's Theorie  -  Fünf Wachstumstreiber  -  Pareto Kurve  -  ABC Analyse  -  CIM Konzept  -  Total Quality Management  -  Supply Chain Management  -  Du Pont Schema.

The PDCA Cycle
The PDCA Cycle
$3.00
Enterprise Management Process
$3.00
SWOT Analysis Diagram
$3.00
SWOT Analysis I
SWOT Analysis I
$3.00
SWOT Analysis II
SWOT Analysis II
$3.00
SWOT Analysis III
SWOT Analysis III
$3.00
The Generic Value Chain I
$3.00
The Generic Value Chain II
$3.00
The Generic Value Chain III
$3.00
The Ansoff Matrix I
The Ansoff Matrix I
$3.00
The Ansoff Matrix II
$3.00
The Customer Growth Matrix
$3.00
Product-Market Diversification
$3.00
BCG's Growth-Share Matrix I
$3.00
BCG's Growth-Share Matrix II
$3.00
BCG's Growth-Share Matrix III
$3.00
BCG's Growth-Share Matrix IV
$3.00
The New BCG Matrix
The New BCG Matrix
$3.00
Underlying Relationship between ROI and Market Share in the New BCG Matrix
$3.00
McKinsey 7-S Framework
$3.00
Disruption and the New 7-S's
$3.00
Core Competencies I
Core Competencies I
$3.00
Core Competencies II
$3.00
Core Competencies III
$3.00