

Back to Overview


Your Review: Note: HTML is not translated!
Rating: Bad Good
Enter the code in the box below:

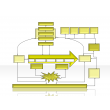


Using a Fishbone Diagram to Quantify Contributing Factors
keywords : strategic management, strategy, strategic evaluation, fishbone diagram
Price:$3.00 Incl. VAT
Add to Cart
 Add to Wishlist

keywords : strategic management, strategy, strategic evaluation, fishbone diagram
Price:$3.00 Incl. VAT
Add to Cart
Add to Wishlist
0 reviews |
Write a review
Write a review
Your Name:Your Review: Note: HTML is not translated!
Rating: Bad Good
Enter the code in the box below:
Last Visited products
flow diagram 2.1.1.404
$2.00
$2.00
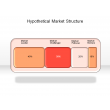
Hypothetical Market Structure
$3.00
$3.00
flow diagram 2.1.1.394
$2.00
$2.00
Histogram 2.2.4.2
$2.00
$2.00