

Search


Search Criteria
Search:
Products meeting the search criteria
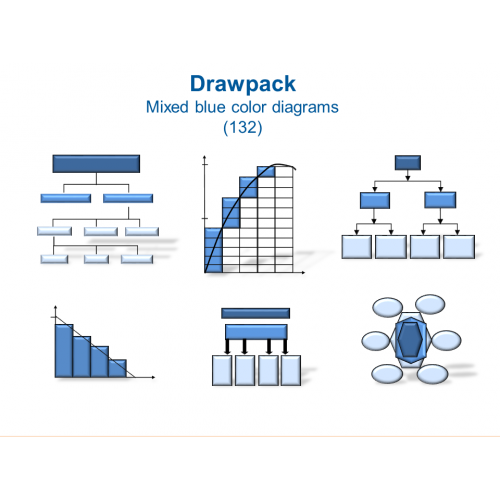
Mixed blue color diagrams
$29.00
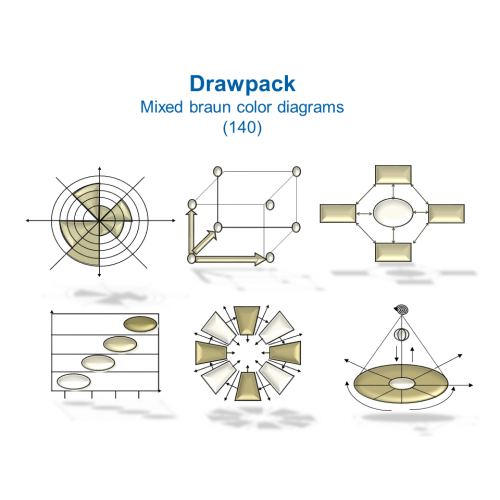
Mixed braun color diagrams
$19.00
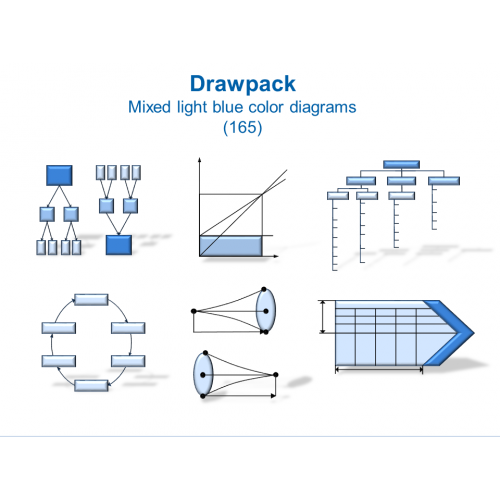
Mixed light blue color diagrams
$29.00
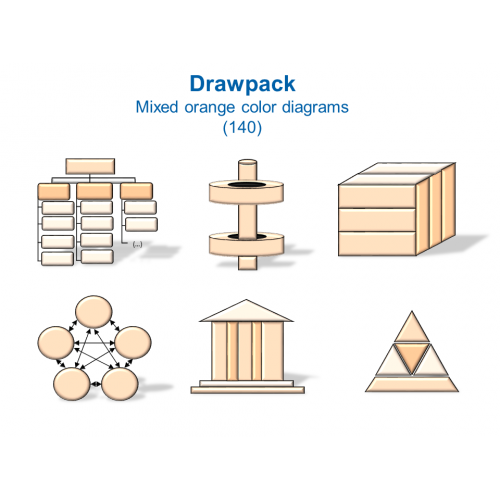
Mixed orange color diagrams
$29.00
Mixed pink color diagrams
$39.00

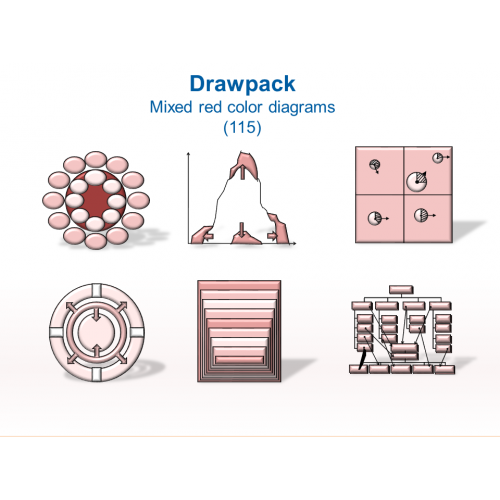
Mixed red color diagrams
$29.00
Mixed turquois color diagrams
$19.00

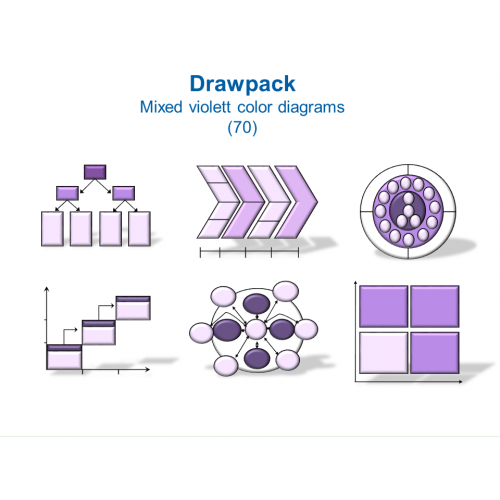
Mixed violett color diagrams
$19.00
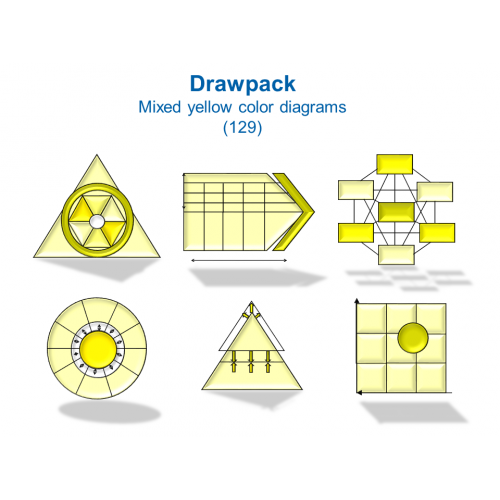
Mixed yellow color diagrams
$19.00
Mobilizing Company Resources to Produce Competitive Advantage
$3.00

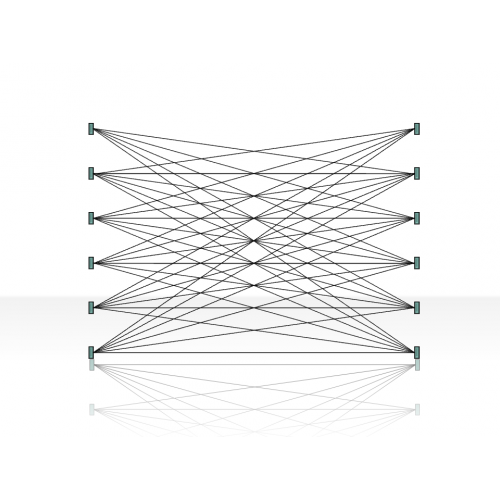
network diagram 2.1.3.1
$2.00
Next-generation Network Architecture
$3.00

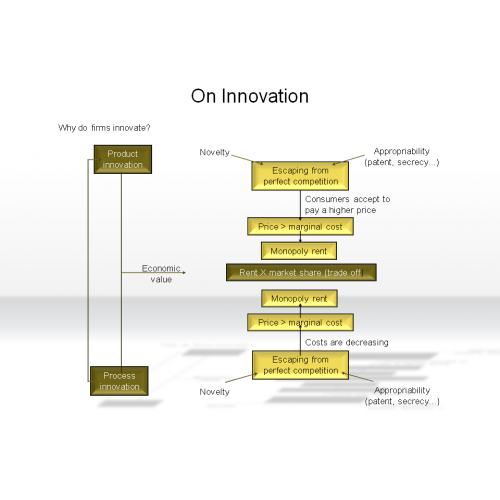
On Innovation
$3.00
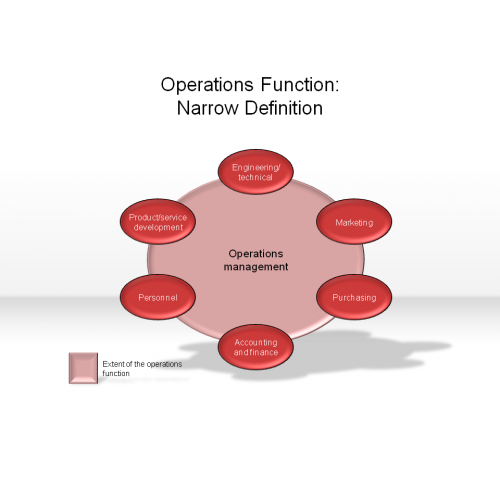
Operations Function: Narrow Definition
$3.00
Organization Matrix 2.4.3.1
$2.00
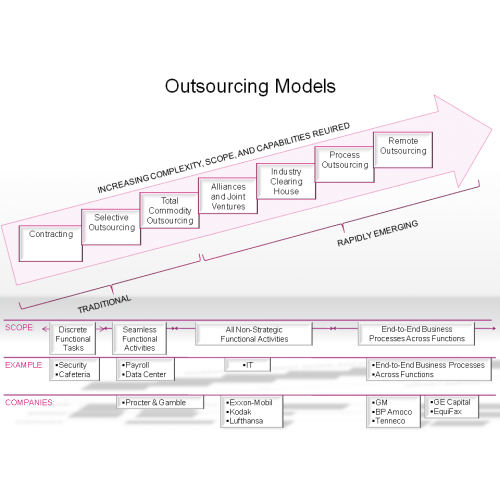
Outsourcing Models
$3.00
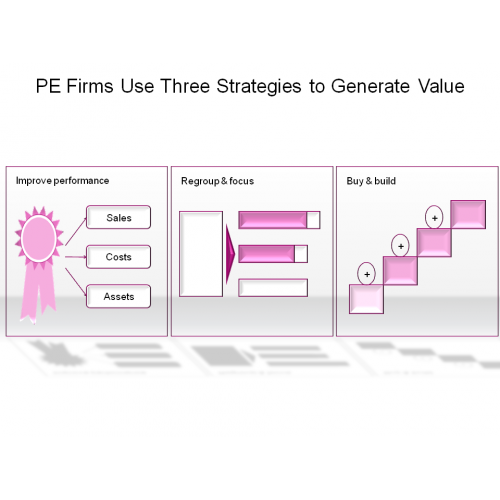
PE Firms Use Three Strategies to Generate Value
$3.00
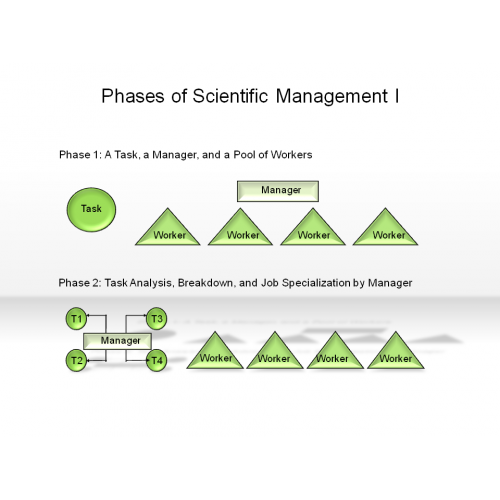
Phases of Scientific Management I
$3.00

Positioning Diagrams 2.5.2.1
$2.00
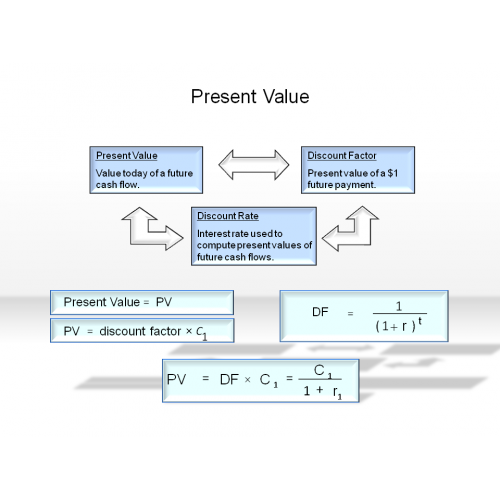
Present Value
$3.00
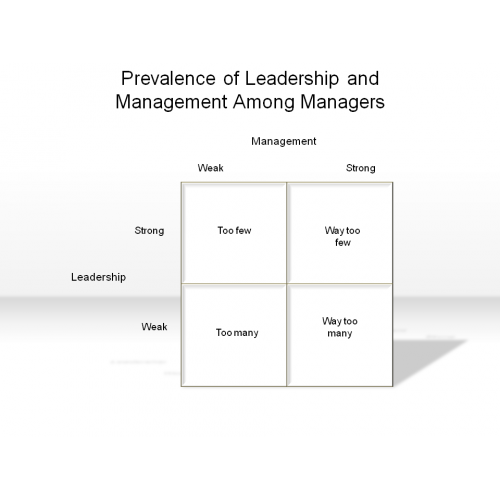
Prevalence of Leadership and Management Among Managers
$3.00
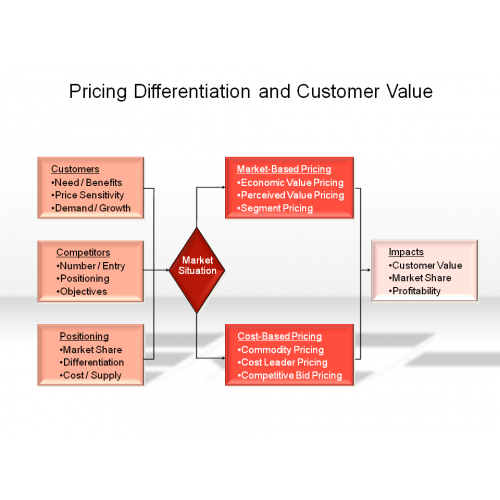
Pricing Differentiation and Customer Value
$3.00
process diagram 2.1.4.1
$2.00
Proportion Diagrams 2.5.4.1
$2.00
Segmentation Diagrams 2.5.3.1
$2.00
Segmentation of the IT Asset Portfolio According to Business Contribution
$3.00

Set & Subset Diagram 2.3.4.1
$2.00
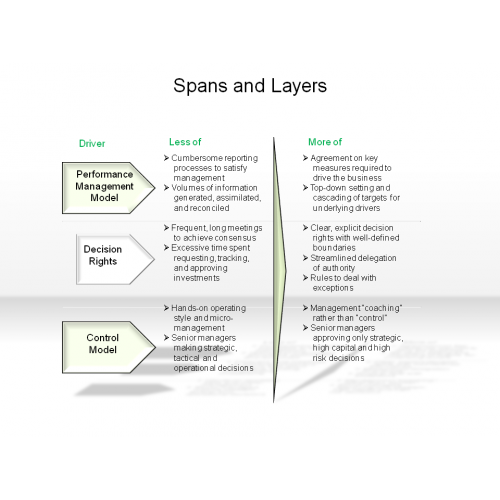
Spans and Layers
$3.00
Square & Cubes 2.3.6.1
$2.00
Stars & Comb Diagram 2.3.5.1
$2.00

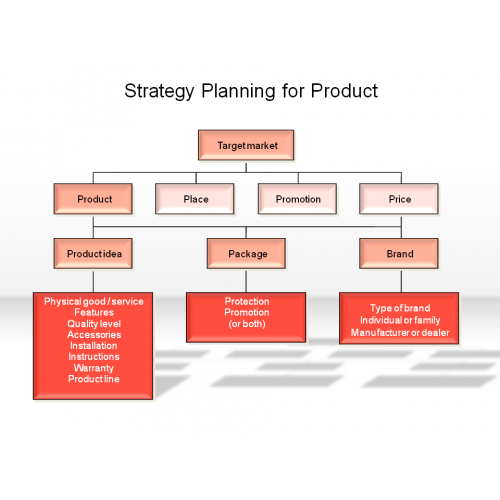
Strategy Planning for Product
$3.00


Supply Chain Management
$3.00
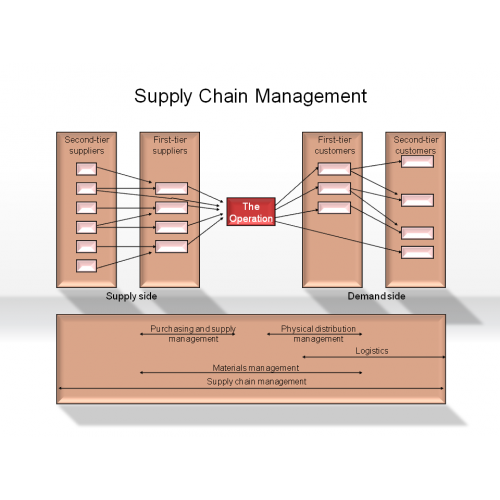

Table Diagrams 2.7.1
$2.00


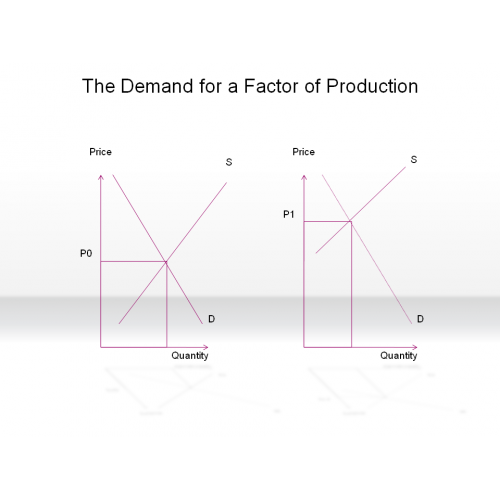
The Demand for a Factor of Production
$3.00
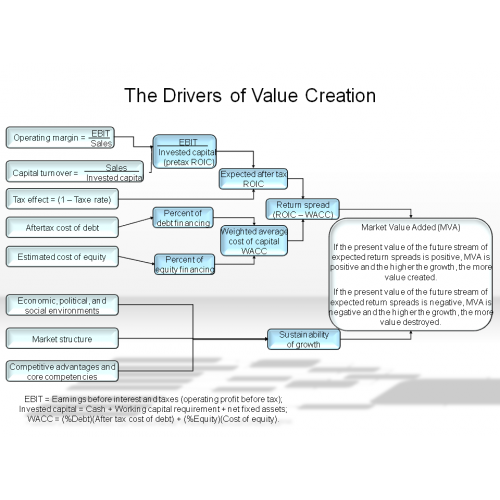
The Drivers of Value Creation
$3.00
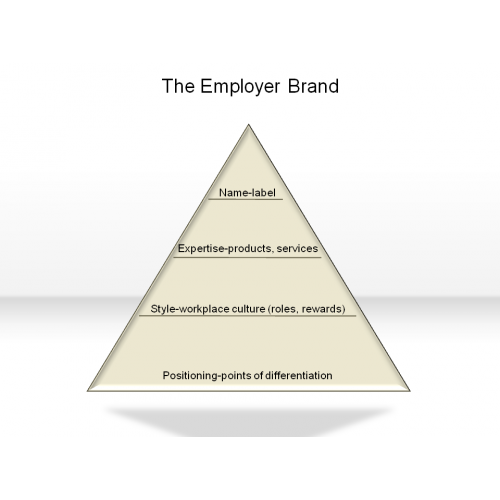
The Employer Brand
$3.00
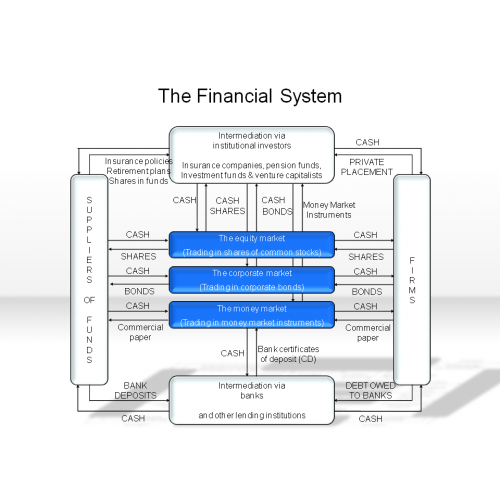
The Financial System
$3.00


The Historical Development of Job Design
$3.00


