
Search


")


Search Criteria
Search:
Products meeting the search criteria
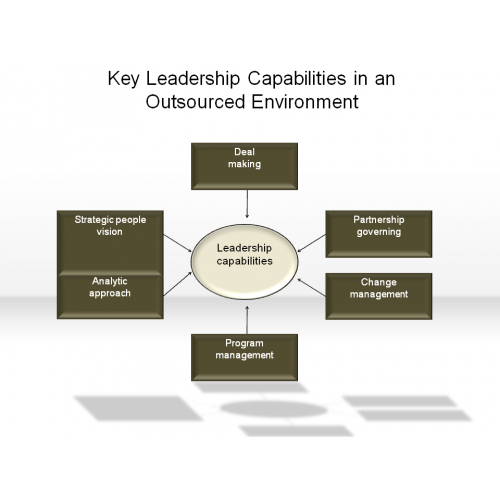
Key Leadership Capabilities in an Outsourced Environment
$3.00
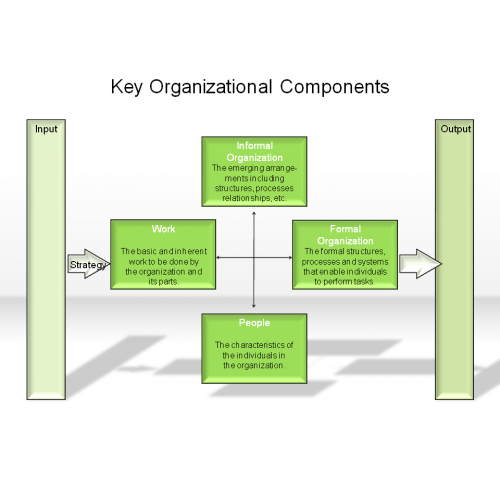
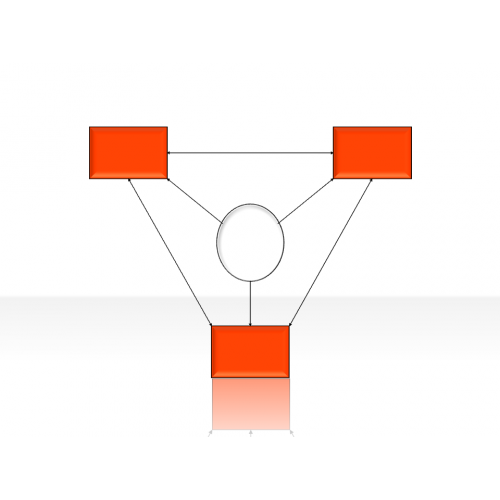
Key Organizational Components
$3.00
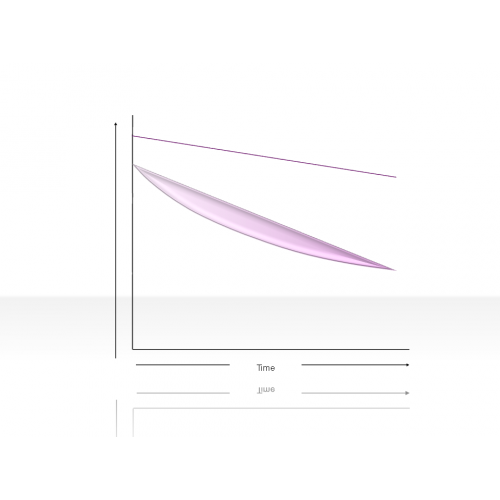
Line Diagram 2.2.6.11
$2.00
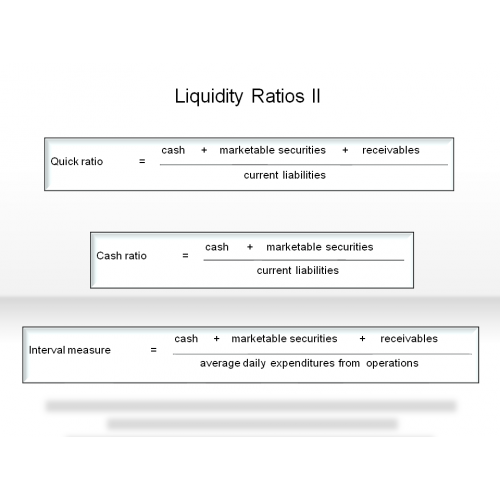
Liquidity Ratios II
$3.00
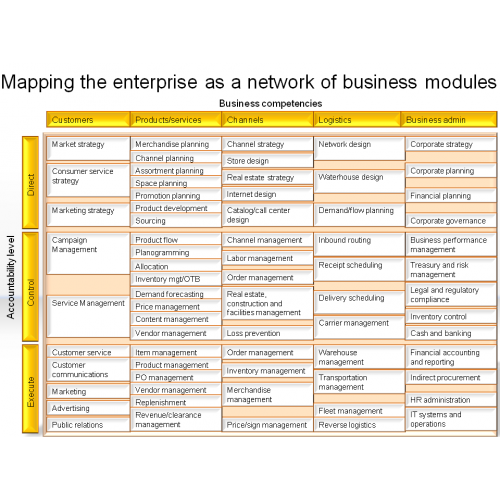
Mapping the enterprise as a network of business modules: an example from the retail industry
$3.00
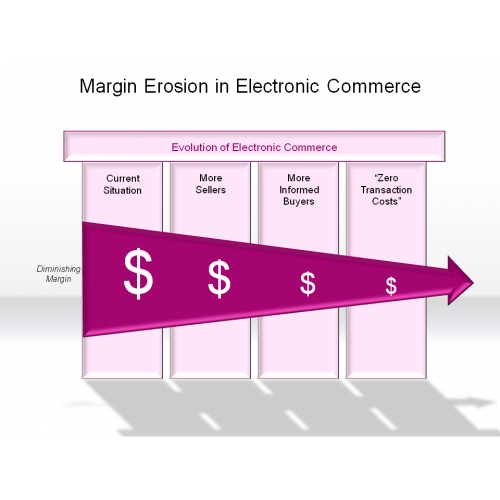
Margin Erosion in Electronic Commerce
$3.00
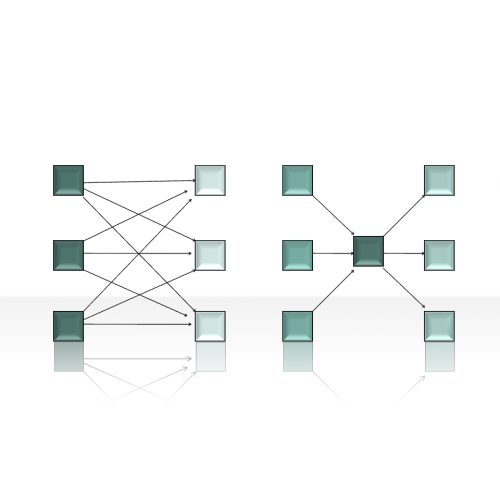
network diagram 2.1.3.11
$2.00
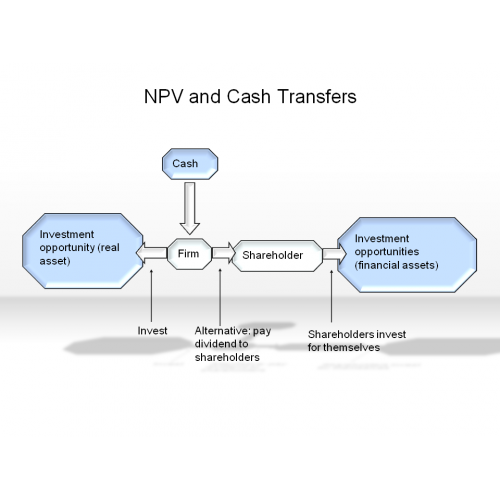
NPV and Cash Transfer
$3.00
Organization Matrix 2.4.3.11
$2.00

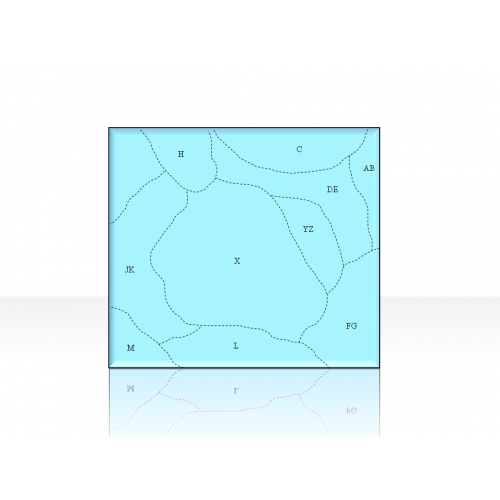
Positioning Diagrams 2.5.2.11
$2.00
Potential Division Management Roles
$3.00

process diagram 2.1.4.11
$2.00
Proportion Diagrams 2.5.4.11
$2.00

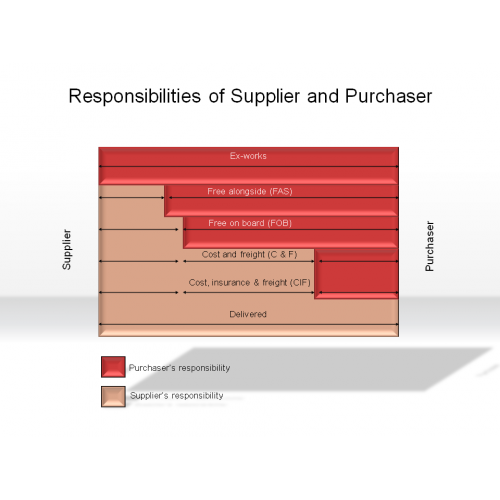
Responsibilities of Supplier and Purchaser
$3.00
S Curve for New Technologies Impacting Compliance
$3.00

Segmentation Diagrams 2.5.3.11
$2.00
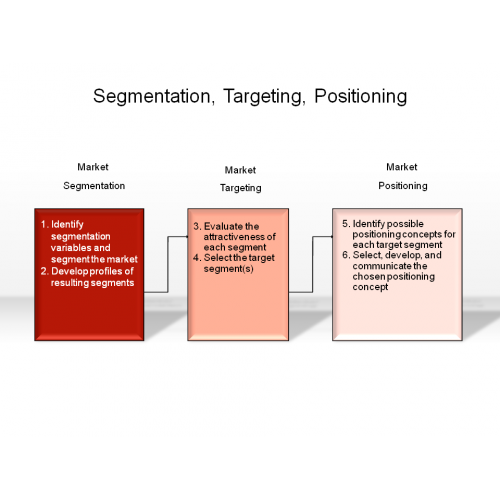
Segmentation, Targeting, Positioning
$3.00
Set & Subset Diagram 2.3.4.11
$2.00

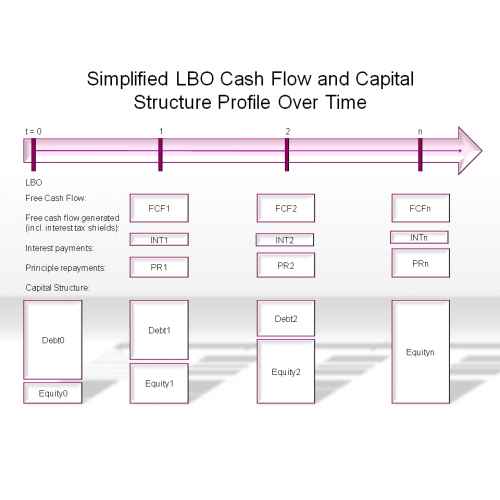
Simplified LBO Cash Flow and Capital Structure Profile Over Time
$3.00
Square & Cubes 2.3.6.11
$2.00

Stars & Comb Diagram 2.3.5.11
$2.00

Table Diagrams 2.7.11
$2.00

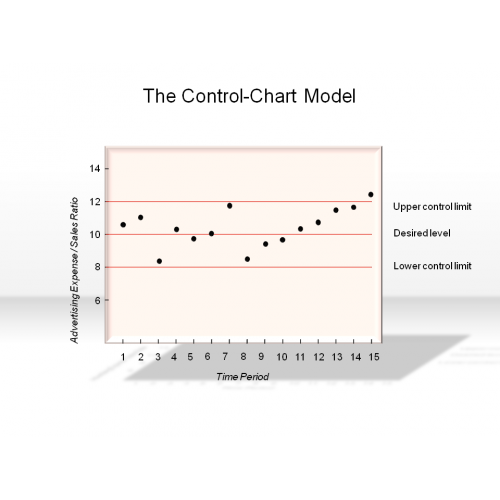
The Control-Chart Model
$3.00
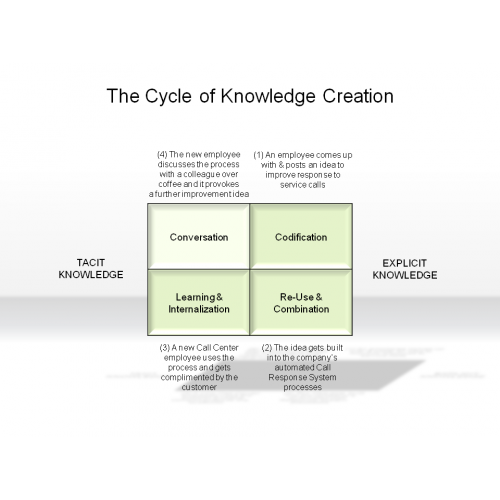
The Cycle of Knowledge Creation
$3.00
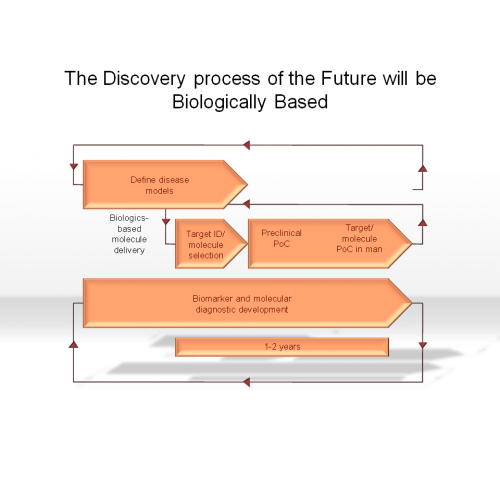
The Discovery process of the Future will be Biologically Based
$3.00
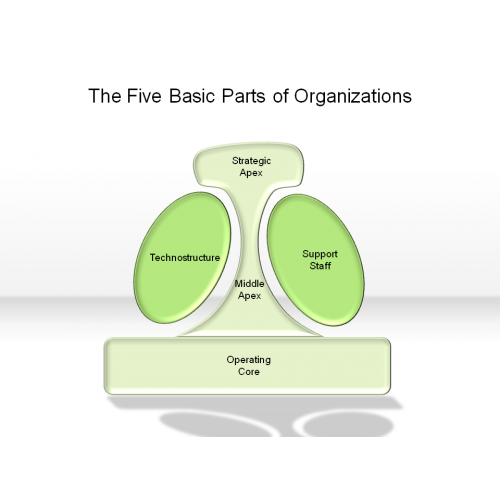
The Five Basic Parts of Organizations
$3.00
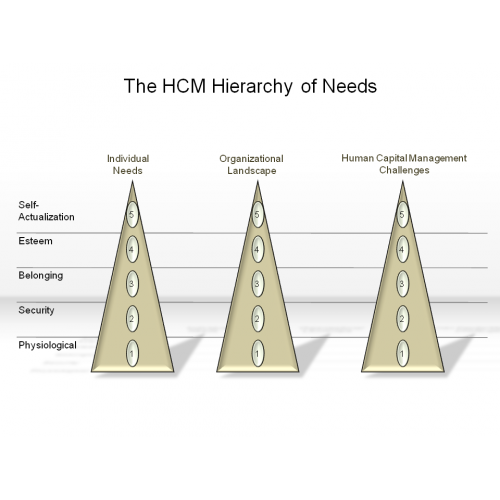
The HCM Hierarchy of Needs
$3.00
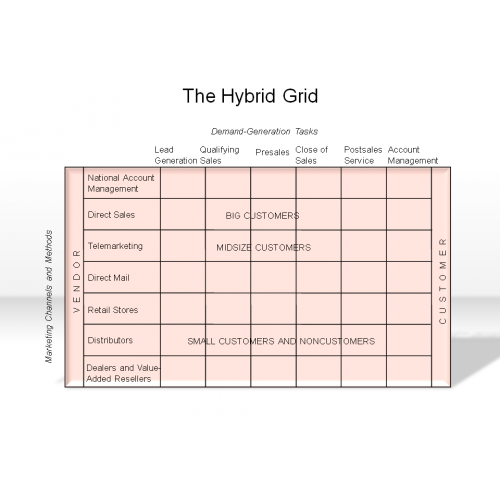
The Hybrid Grid
$3.00
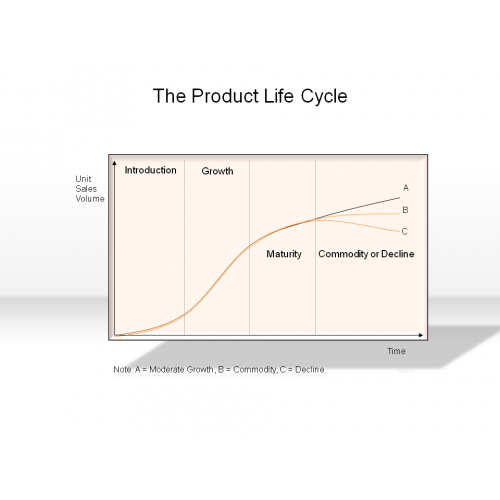
The Product Life Cycle
$3.00
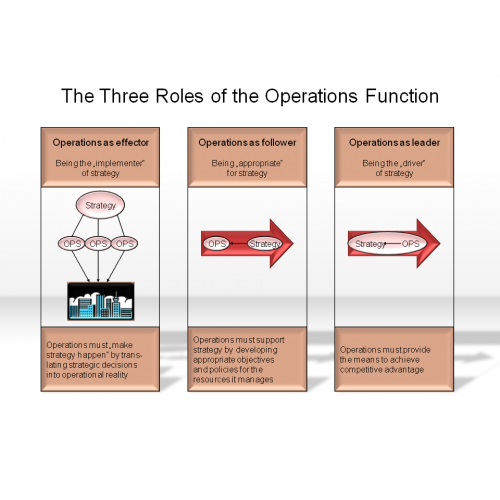
The Three Roles of the Operations Function
$3.00
Triangle & Pyramids 2.3.1.11
$2.00

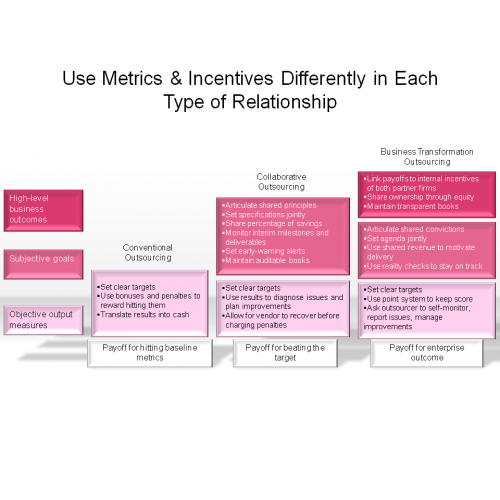
Use Metrics & Incentives Differently in Each Type of Relationship
$3.00
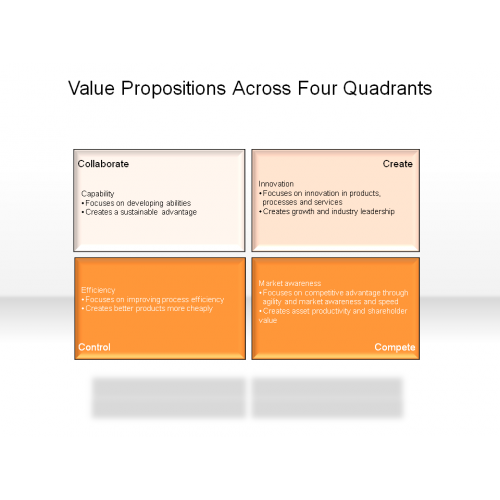
Value Propositions Across Four Quadrants
$3.00
Virtual Organizations and Virtual Cultures
$3.00

Where it will End up
$3.00

2-Axis diagram 2.2.1.12
$2.00
4-Axis diagram 2.2.2.12
$2.00
4-Field Matrix 2.4.1.12
$2.00

9-Field Matrix 2.4.2.12
$2.00
90 Types of Demand Measurement (6*5*3)
$3.00

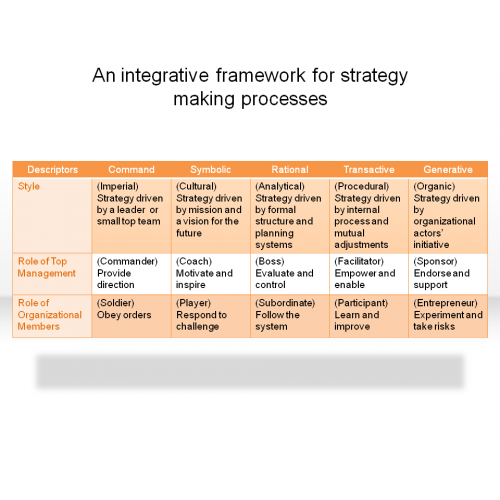
An integrative framework for strategy making processes
$3.00
Bar diagram 2.2.3.12
$2.00
Basic Business Model 3.1.2.12
$2.00
business captain 4.3.1.12
$2.00
business champ 4.3.2.12
$2.00
business chief 4.3.3.12
$2.00
business chief 4.3.4.12
$2.00
business executive 4.3.5.12
$2.00
business expert 4.3.6.12
$2.00
business head 4.3.7.12
$2.00
business king 4.3.8.12
$2.00
business man 4.3.9.12
$2.00
business master 4.3.10.12
$2.00
business one 4.3.11.12
$2.00
business power 4.3.12.12
$2.00
business principle 4.3.13.12
$2.00
business star 4.3.14.12
$2.00
business success 4.3.15.12
$2.00
Circle Diagram 2.3.2.12
$2.00

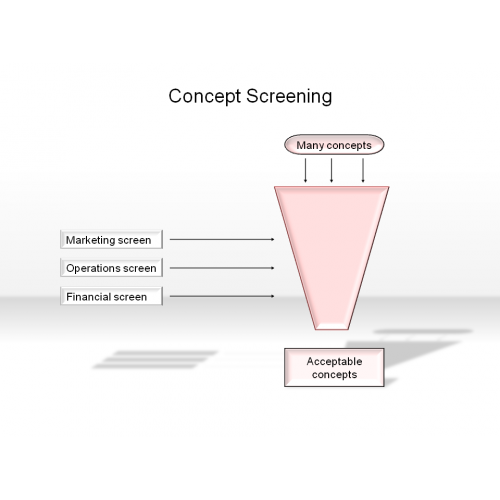
Concept Screening
$3.00
Convergence Diagrams 2.5.1.12
$2.00

Cross Diagram 2.3.3.12
$2.00
Curve Diagram 2.2.5.12
$2.00
cycle diagram 2.1.2.12
$2.00
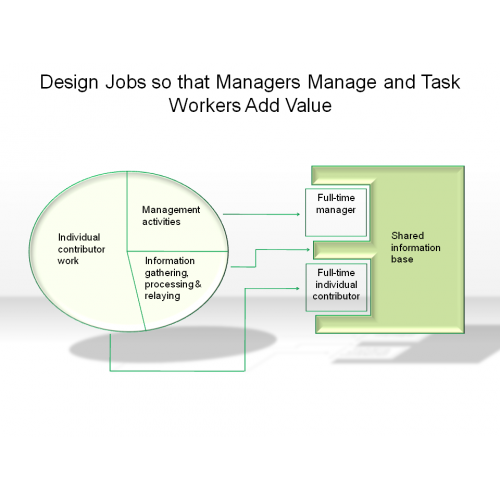
Design Jobs so that Managers Manage and Task Workers Add Value
$3.00
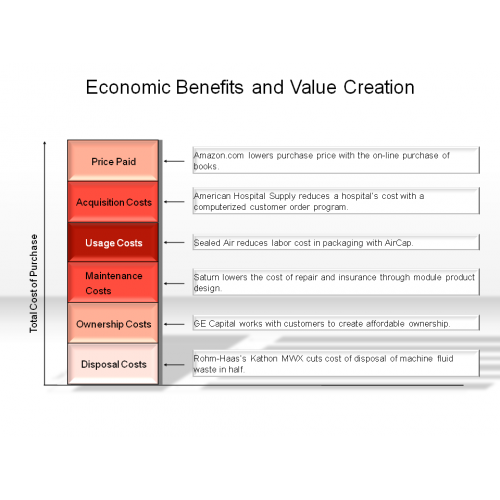
Economic Benefits and Value Creation
$3.00
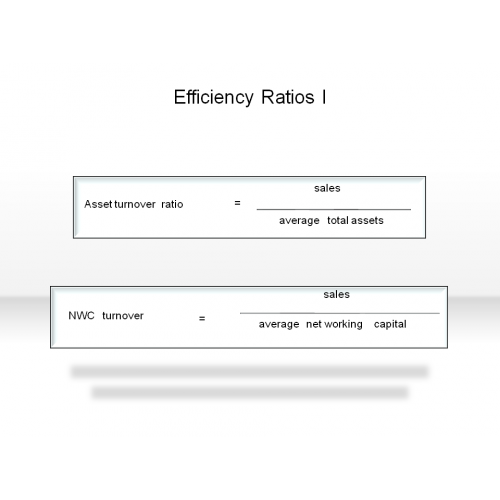
Efficiency Ratios I
$3.00
Factors Shaping the Choice of Company Strategy
$3.00

flow diagram 2.1.1.12
$2.00


Heat maps identify “hot” areas to exploit business value
$3.00

Hierarchy Diagrams 2.6.12
$2.00
Histogram 2.2.4.12
$2.00
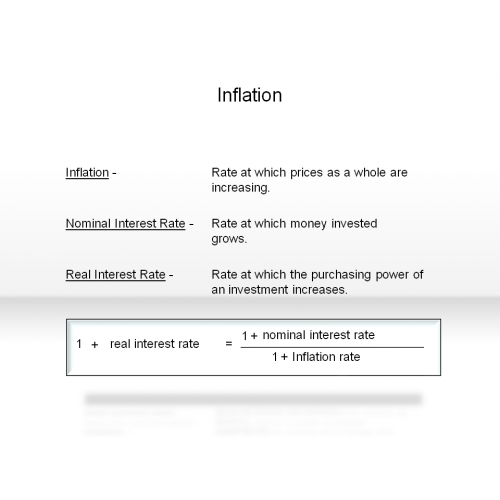
Inflation
$3.00
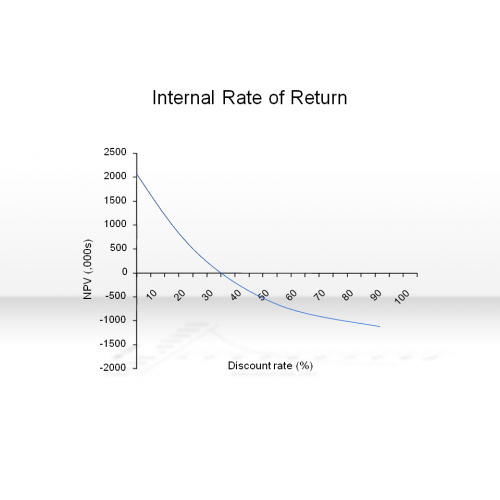
Internal Rate of Return
$3.00
Knowledge Management Life Cycle
$3.00

Line Diagram 2.2.6.12
$2.00
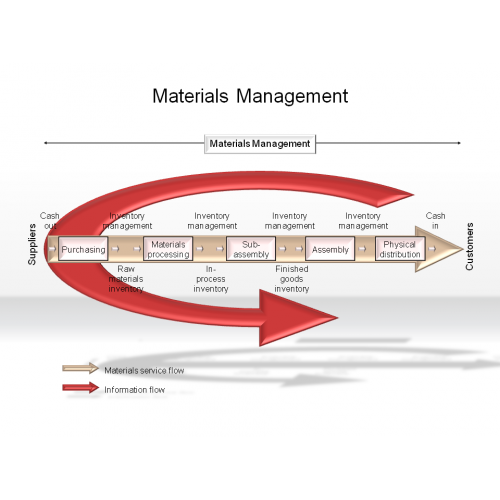
Materials Management
$3.00
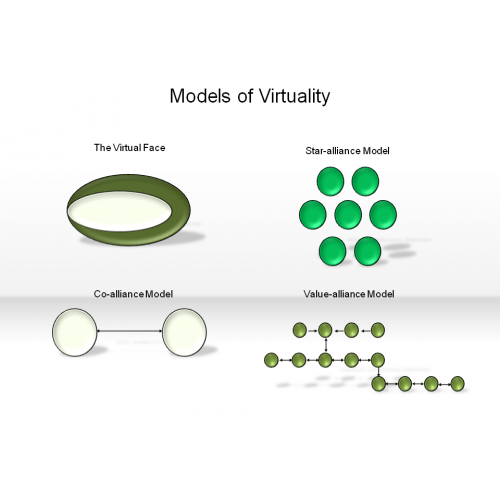
Models of Virtuality
$3.00
network diagram 2.1.3.12
$2.00

Opportunities for Disintermediation in Electronic Commerce
$3.00

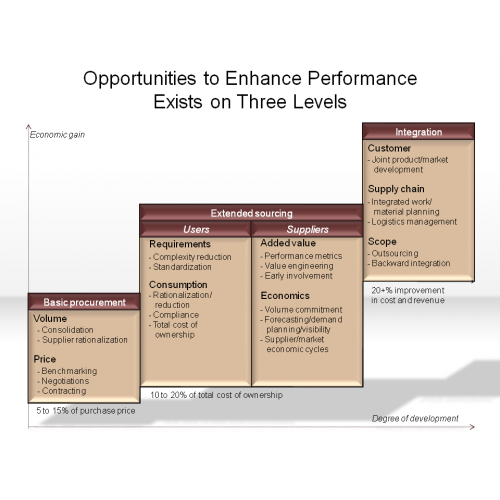
Opportunities to Enhance Performance Exists on Three Levels
$3.00
Organization Matrix 2.4.3.12
$2.00
Positioning Diagrams 2.5.2.12
$2.00
process diagram 2.1.4.12
$2.00
Product Life Cycle and Offensive and Defensive Marketing Strategies
$3.00

Proportion Diagrams 2.5.4.12
$2.00

Redefining Total Rewards
$3.00

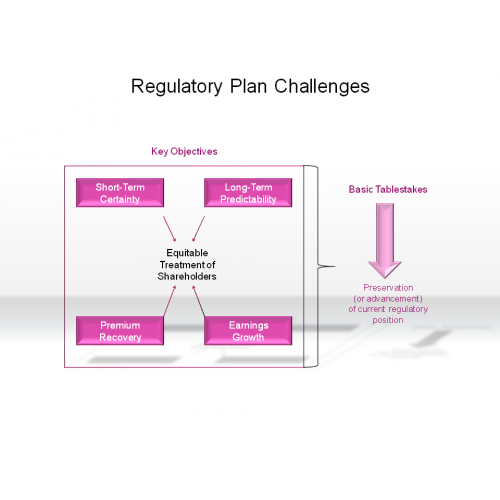
Regulatory Plan Challenges
$3.00
Relationship Between Service Levels and Costs
$3.00

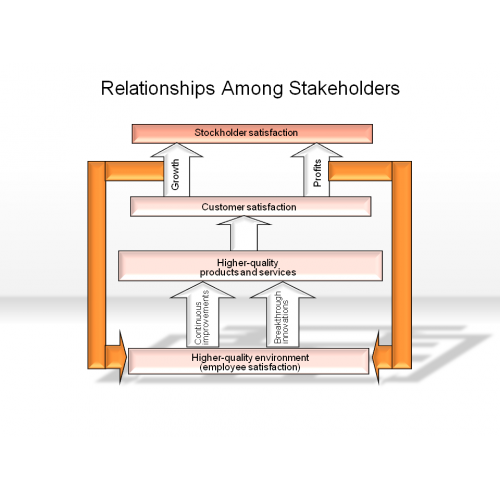
Relationships Among Stakeholders
$3.00
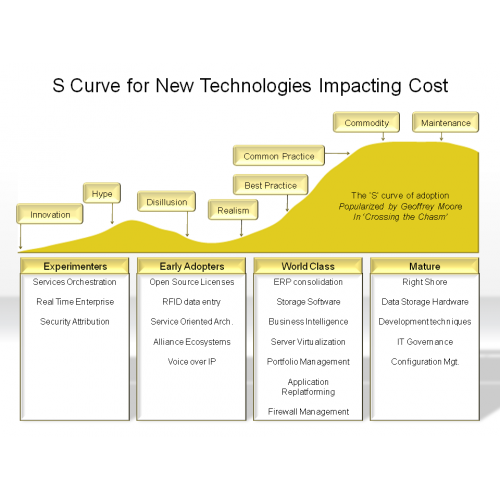
S Curve for New Technologies Impacting Cost
$3.00
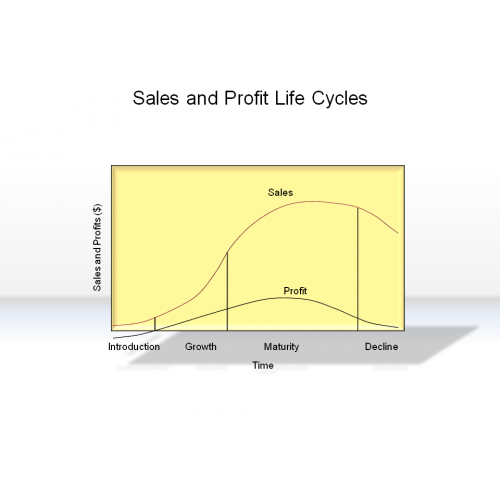
Sales and Profit Life Cycles
$3.00
Segmentation Diagrams 2.5.3.12
$2.00

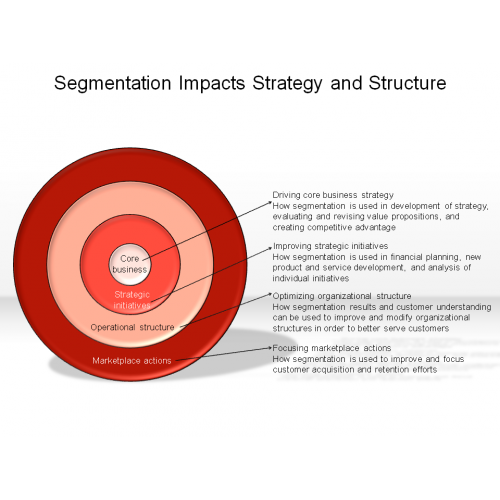
Segmentation Impacts Strategy and Structure
$3.00
Set & Subset Diagram 2.3.4.12
$2.00