
Search


Search Criteria
Search:
Products meeting the search criteria
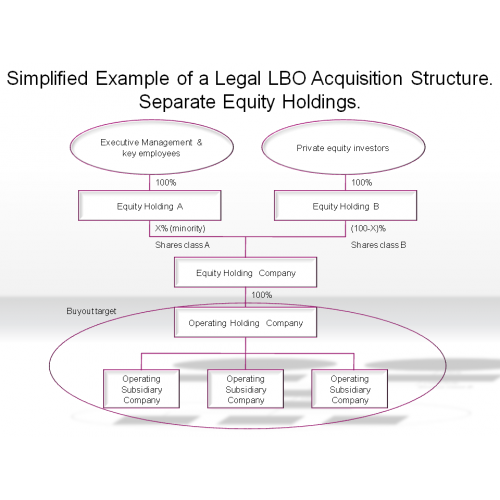
Simplified Example of a Legal LBO Acquisition Structure. Separate Equity Holdings
$3.00
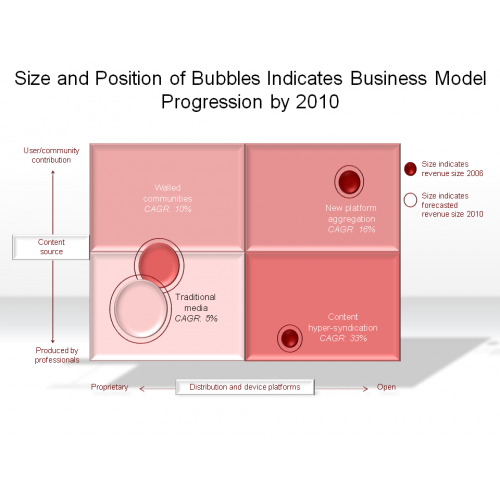
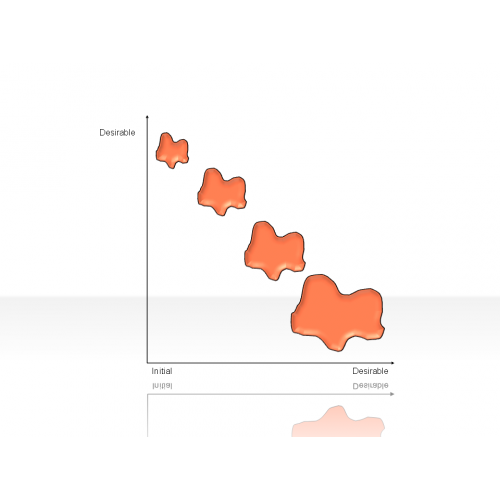
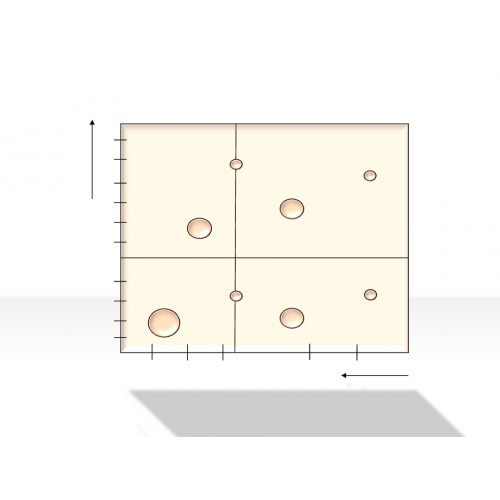
Size and Position of Bubbles Indicates Business Model Progression by 2010
$3.00
Square & Cubes 2.3.6.12
$2.00
Stages of Excellence of Self-Assessment Tools
$3.00

Stars & Comb Diagram 2.3.5.12
$2.00

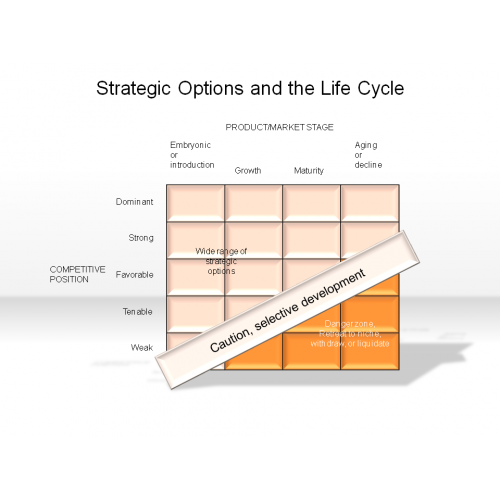
Strategic Options and the Life Cycle
$3.00
Structure-Conduct-Performance Model
$3.00
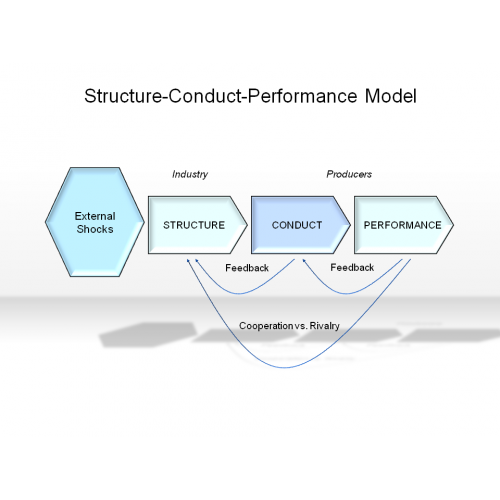
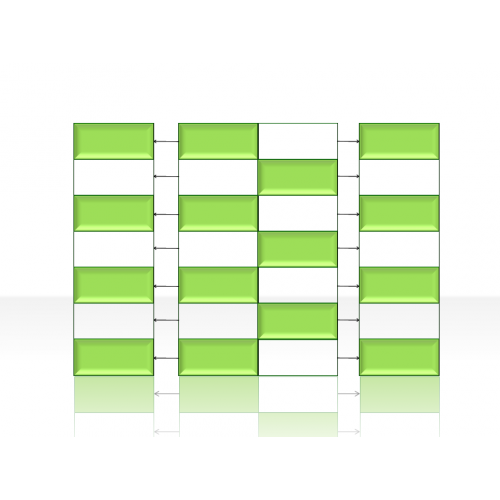
Table Diagrams 2.7.12
$2.00
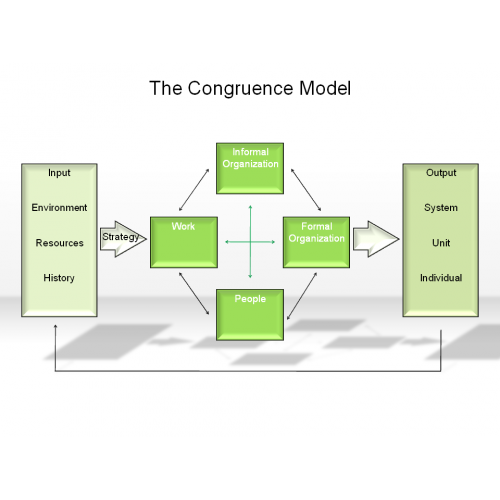
The Congruence Model
$3.00
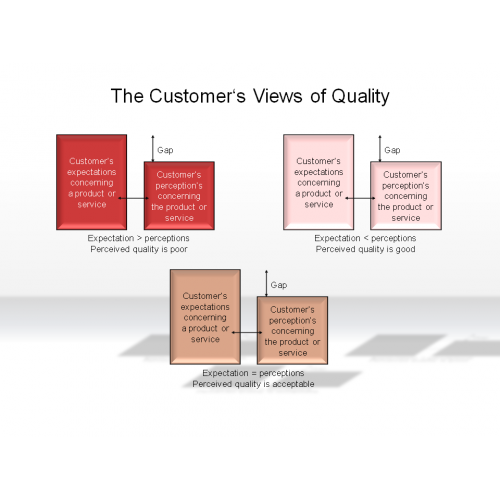
The Customer's Views of Quality
$3.00
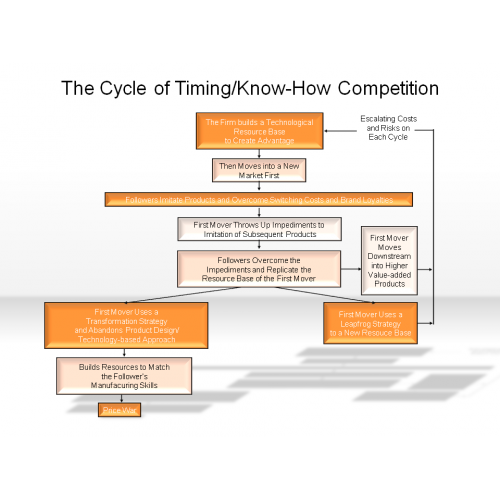
The Cycle of Timing/Know-How Competition
$3.00
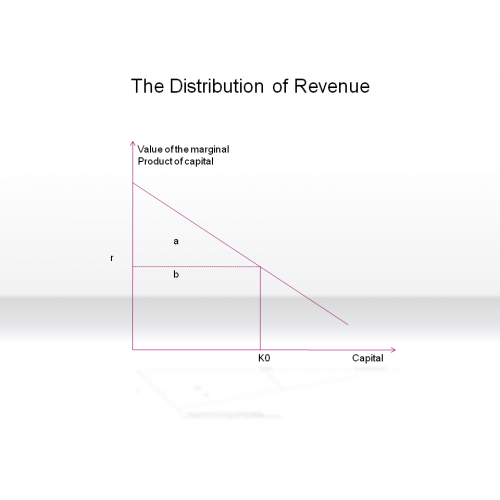
The Distribution of Revenue
$3.00
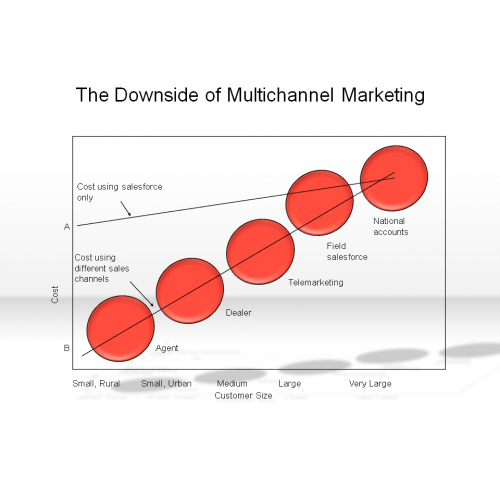
The Downside of Multichannel Marketing
$3.00
The Flow of Formal Authority
$3.00
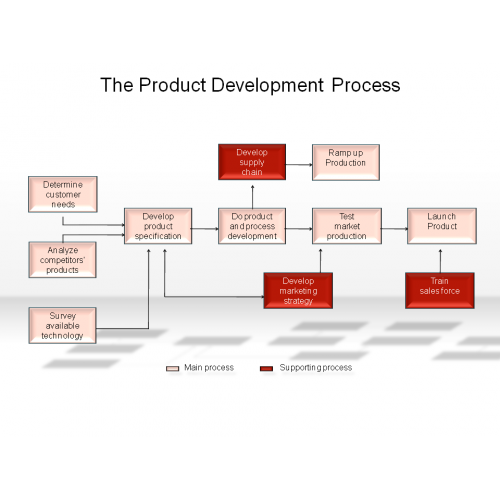
The Product Development Process
$3.00
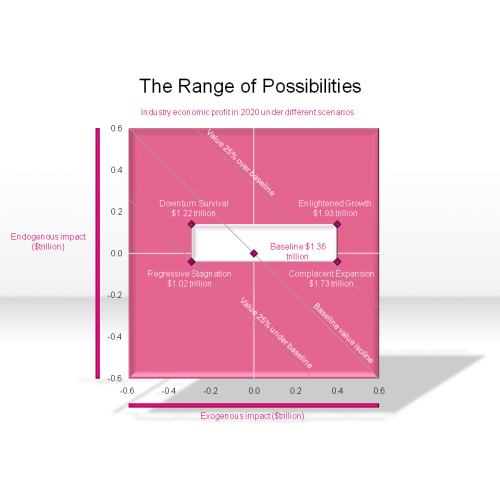
The Range of Possibilities
$3.00
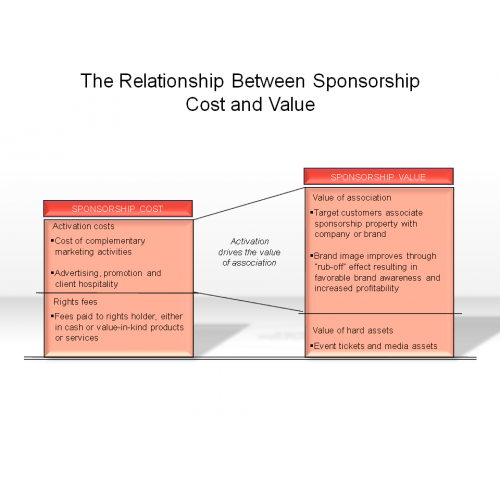
The Relationship Between Sponsorship, Cost and Value
$3.00
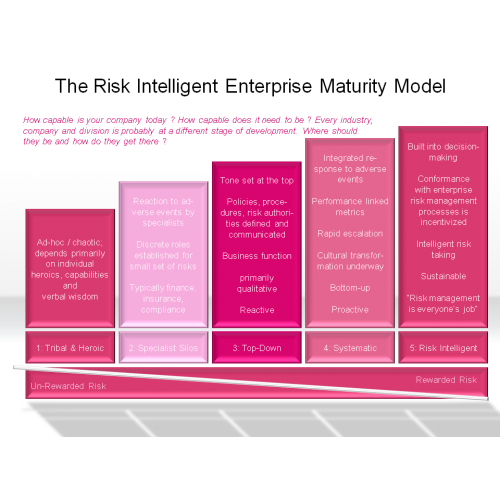
The Risk Intelligent Enterprise Maturity Model
$3.00
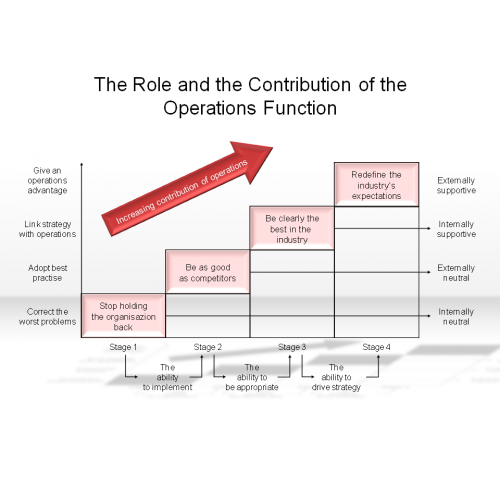
The Role and the Contribution of the Operations Function
$3.00
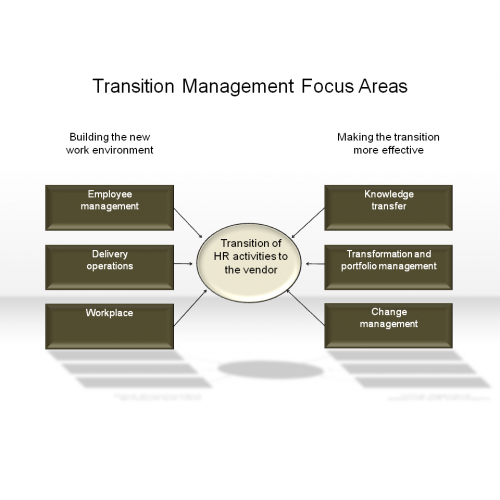
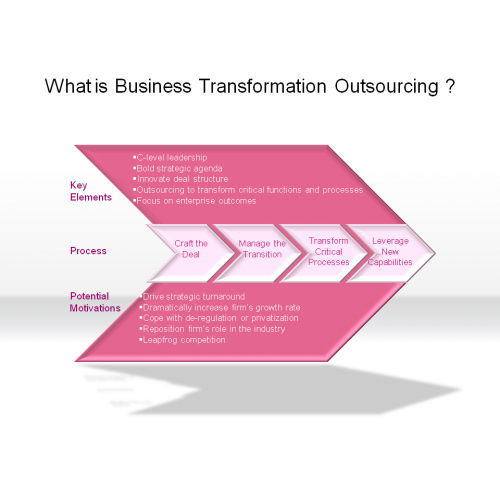
Transition Management Focus Areas
$3.00
Triangle & Pyramids 2.3.1.12
$2.00
What is Business Transformation Outsourcing ?
$3.00
2-Axis diagram 2.2.1.13
$2.00
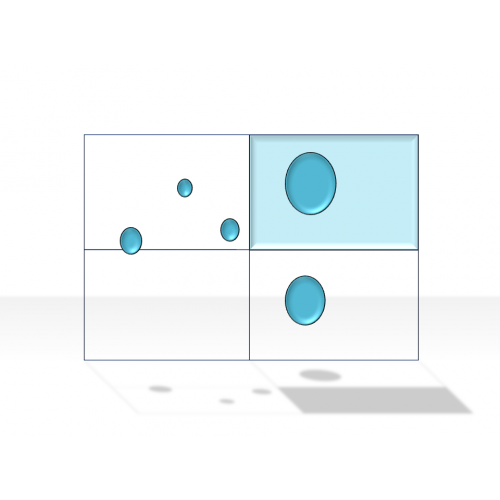
4-Field Matrix 2.4.1.13
$2.00

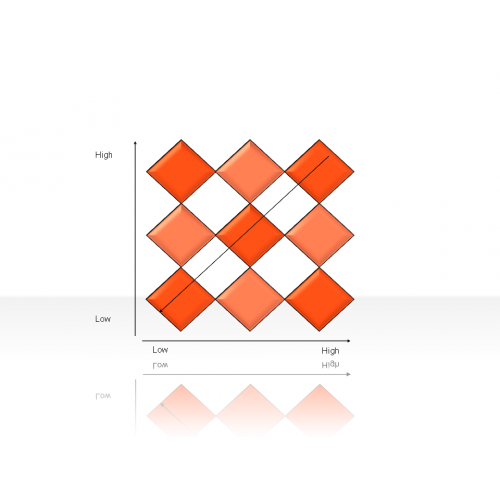
9-Field Matrix 2.4.2.13
$2.00
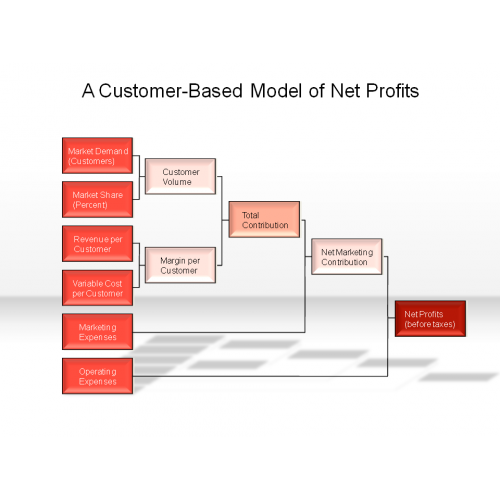
A Customer-Based Model of Net Profits
$3.00
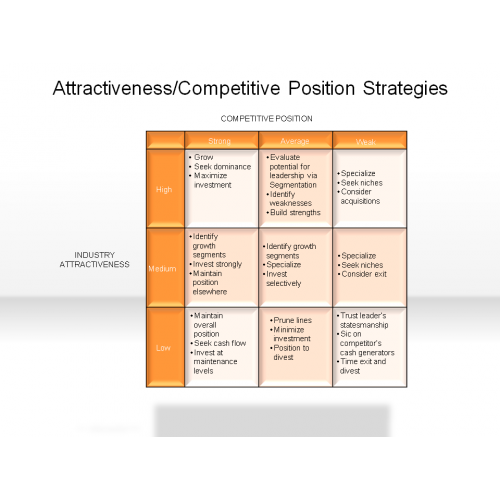
Attractiveness/Competitive Position Strategies
$3.00
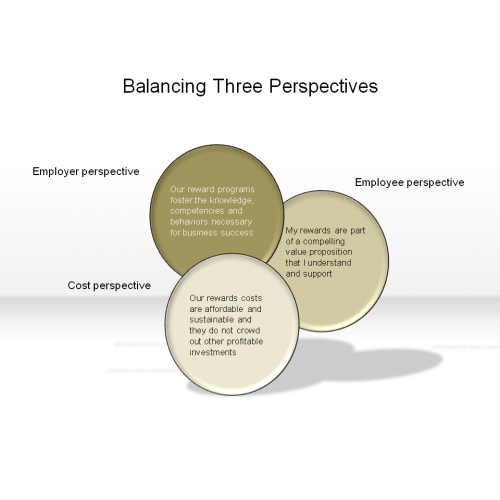
Balancing Three Perspectives
$3.00
Bar diagram 2.2.3.13
$2.00
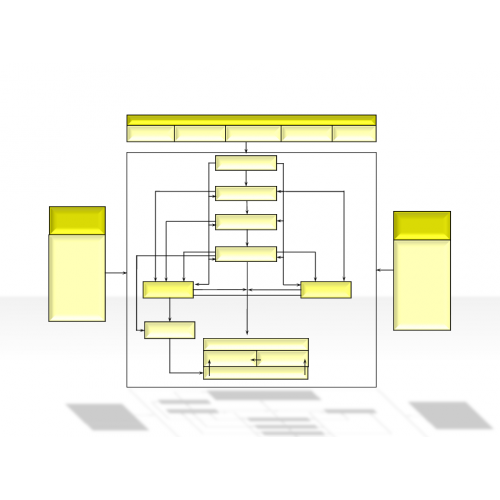
Basic Business Model 3.1.2.13
$2.00
business captain 4.3.1.13
$2.00

business champ 4.3.2.13
$2.00

business chief 4.3.3.13
$2.00
business chief 4.3.4.13
$2.00
business executive 4.3.5.13
$2.00

business expert 4.3.6.13
$2.00
business head 4.3.7.13
$2.00
business king 4.3.8.13
$2.00
business man 4.3.9.13
$2.00
business master 4.3.10.13
$2.00
business one 4.3.11.13
$2.00

business power 4.3.12.13
$2.00
business principle 4.3.13.13
$2.00
business star 4.3.14.13
$2.00
business success 4.3.15.13
$2.00
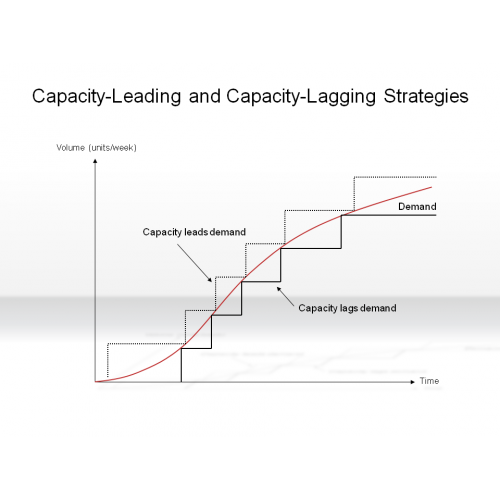
Capacity-Leading and Capacity-Lagging Strategies
$3.00
Circle Diagram 2.3.2.13
$2.00

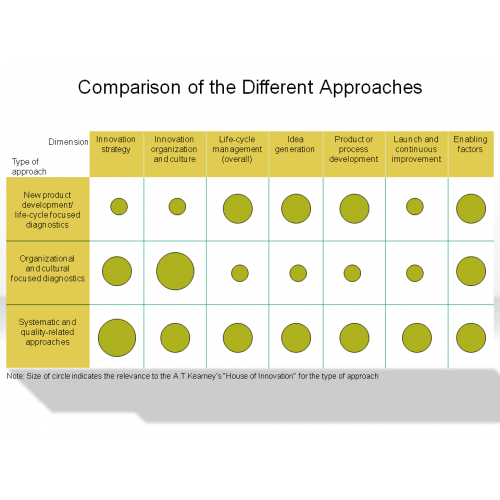
Comparison of the Different Approaches
$3.00
Convergence Diagrams 2.5.1.13
$2.00
Cross Diagram 2.3.3.13
$2.00
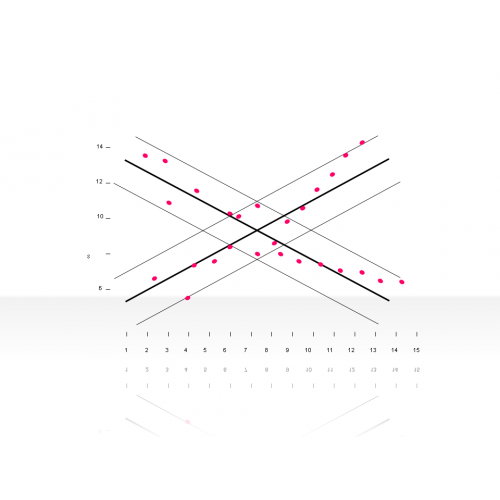
Curve Diagram 2.2.5.13
$2.00
cycle diagram 2.1.2.13
$2.00
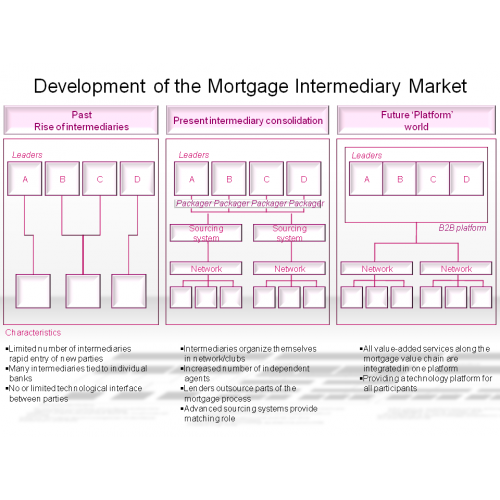
Development of the Mortgage Intermediary Market
$3.00
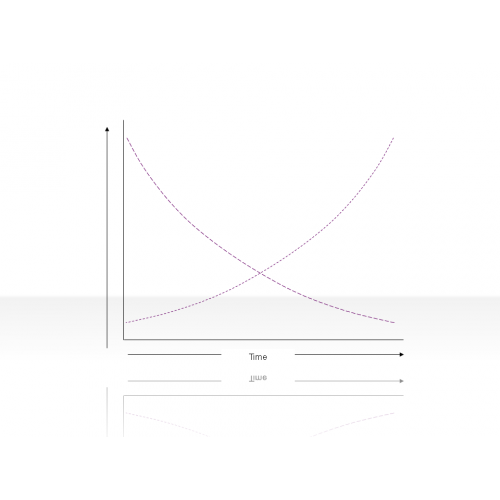
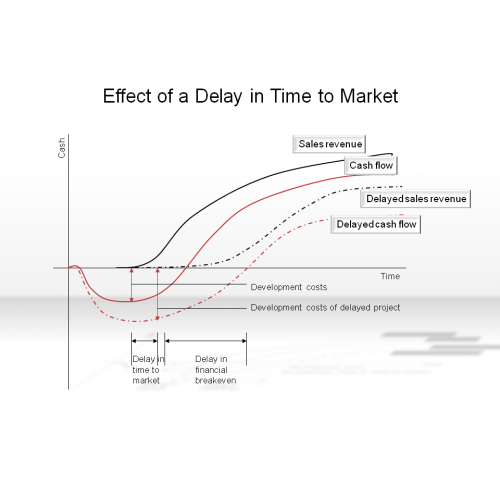
Effect of a Delay in Time to Market
$3.00
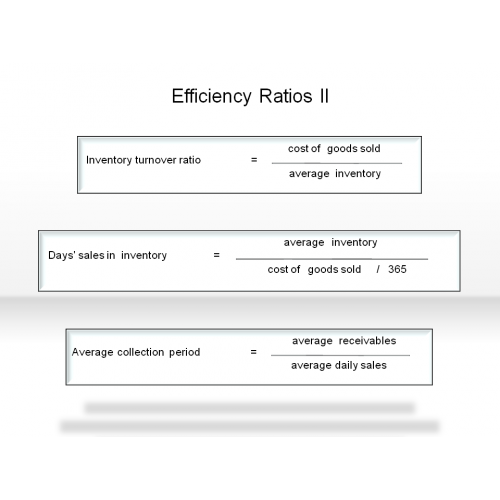
Efficiency Ratios II
$3.00
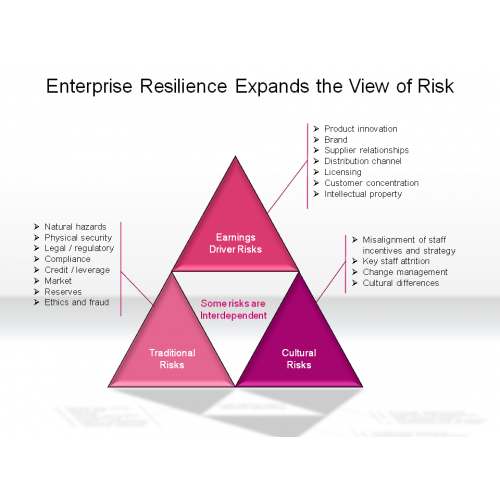
Enterprise Resilience Expands the View of Risk
$3.00
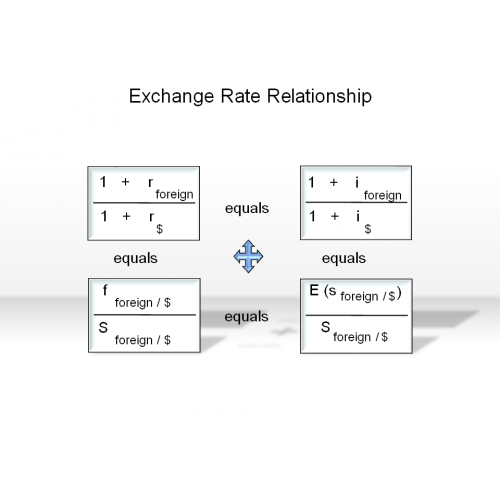
Exchange Rate Relationship
$3.00
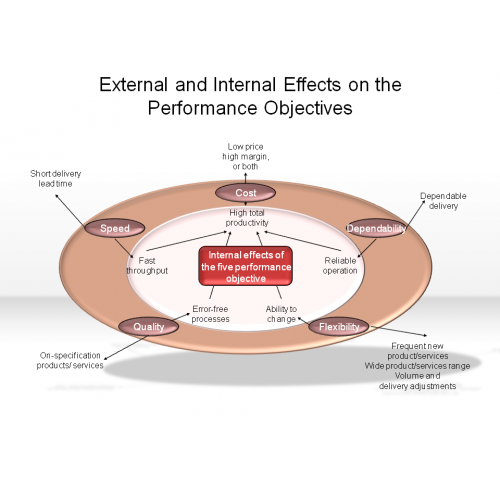
External and Internal Effects on the Performance Objectives
$3.00
flow diagram 2.1.1.13
$2.00


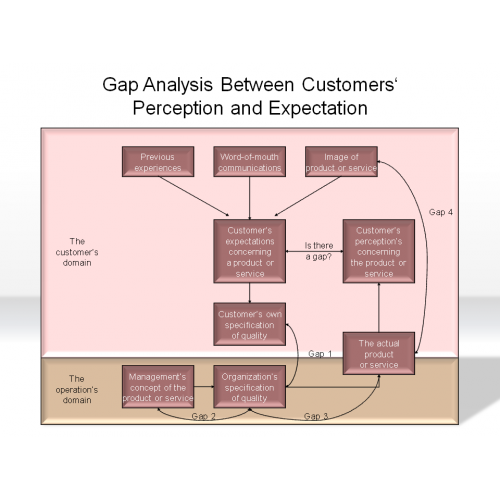
Gap Analysis Between Customers' Perception and Expectation
$3.00
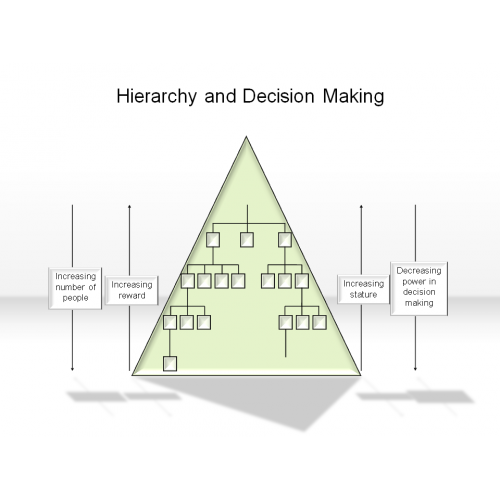
Hierarchy and Decision Making
$3.00
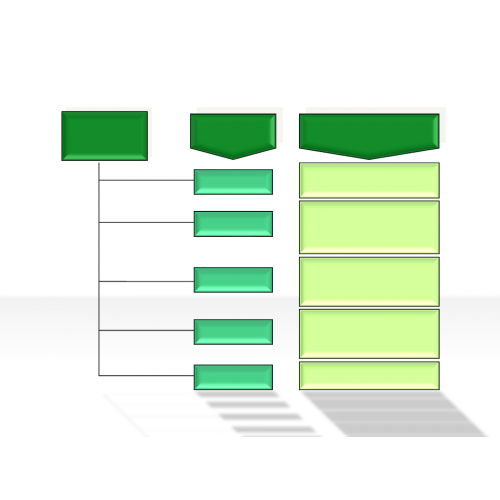
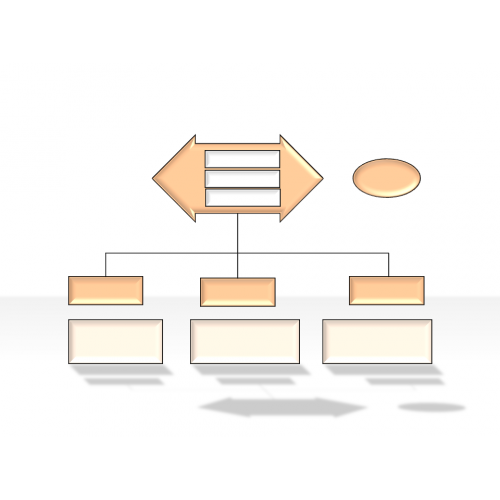
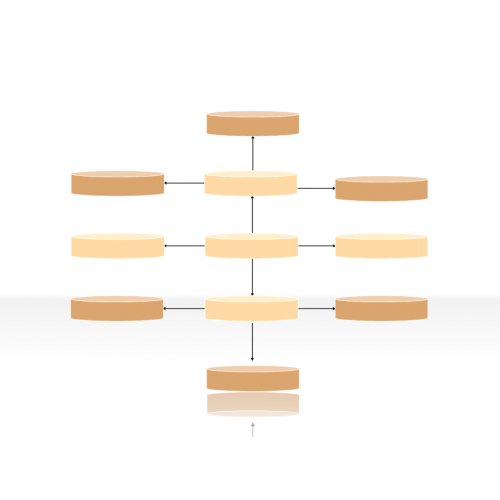
Hierarchy Diagrams 2.6.13
$2.00
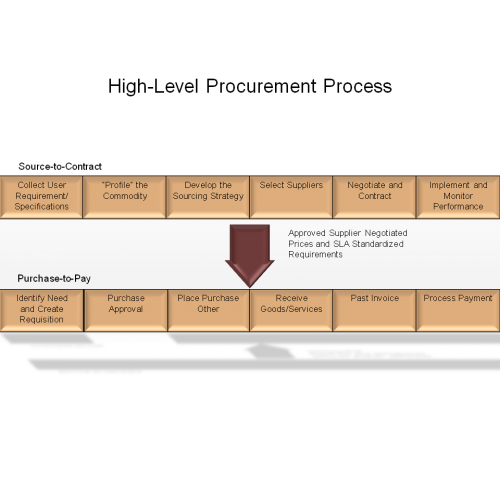
High-Level Procurement Process
$3.00
Histogram 2.2.4.13
$2.00

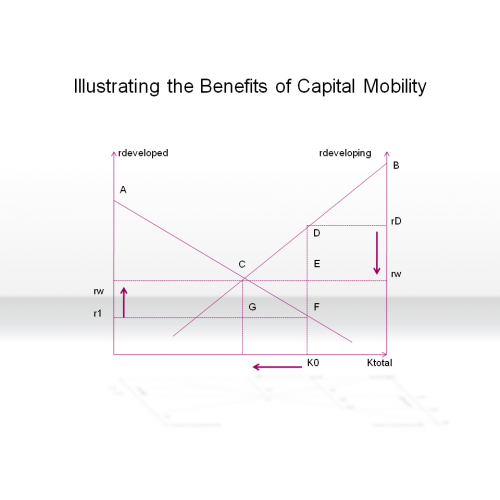
Illustrating the Benefits of Capital Mobility
$3.00
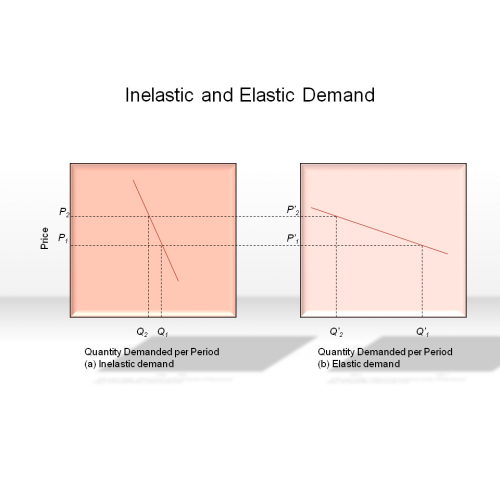
Inelastic and Elastic Demand
$3.00
Integrative framework for strategy research
$3.00

Knowledge Management
$3.00

Line Diagram 2.2.6.13
$2.00
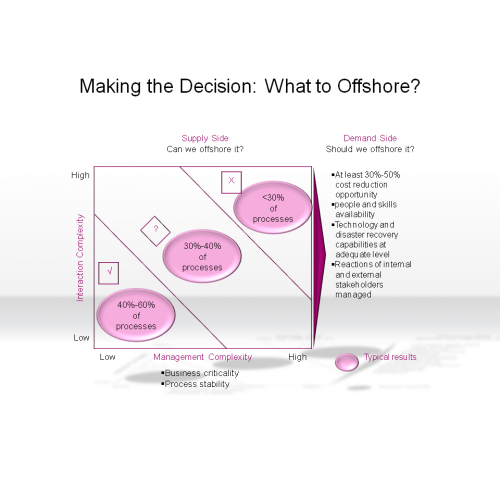
Making the Decision: What to Offshore?
$3.00
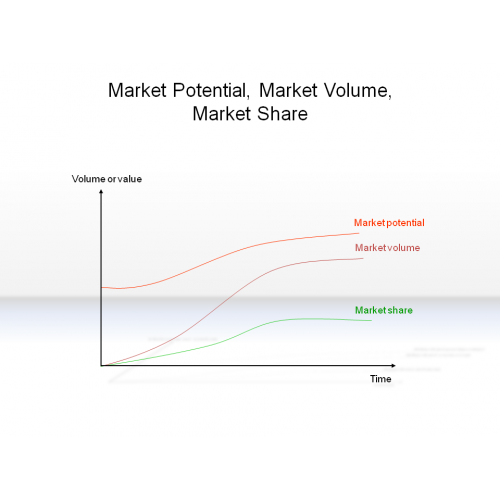
Market Potential, Market Volume, Market Share
$3.00
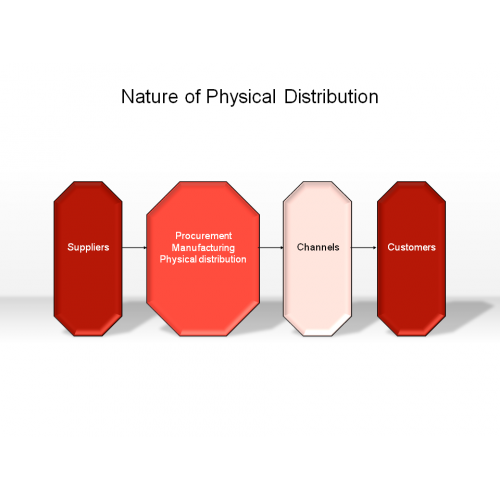
Nature of Physical Distribution
$3.00
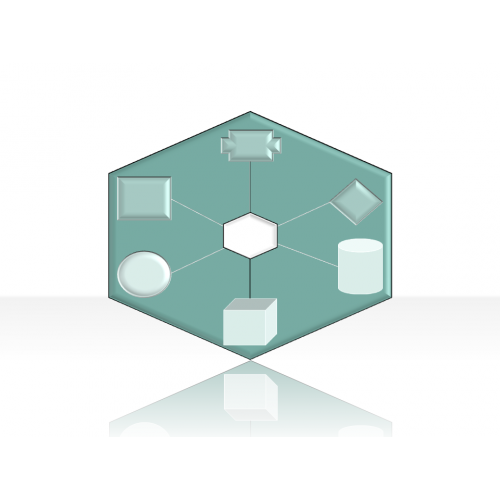
network diagram 2.1.3.13
$2.00
Offensive and Defensive Strategic Market Plans
$3.00

Organization Matrix 2.4.3.13
$2.00

Positioning Diagrams 2.5.2.13
$2.00

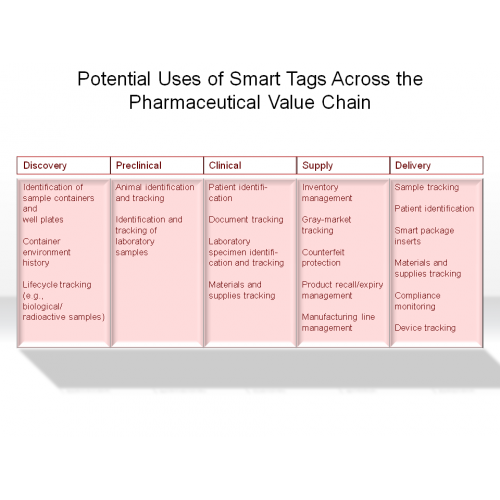
Potential Uses of Smart Tags Across the Pharmaceutical Value Chain
$3.00
process diagram 2.1.4.13
$2.00
Proportion Diagrams 2.5.4.13
$2.00
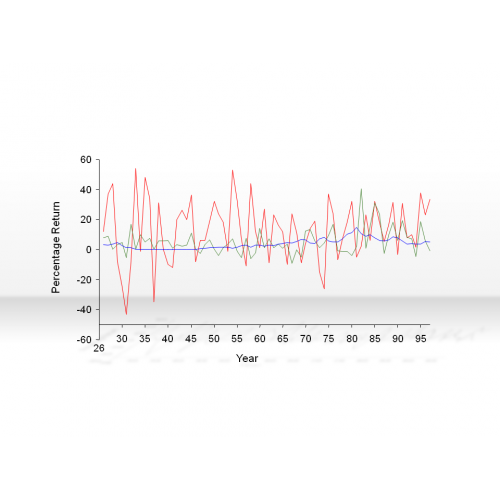
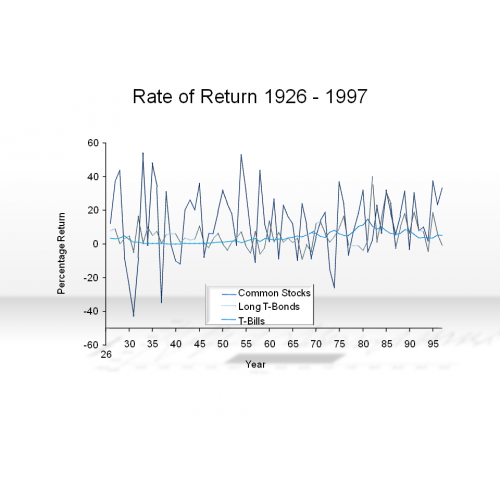
Rate of Return 1926 - 1997
$3.00
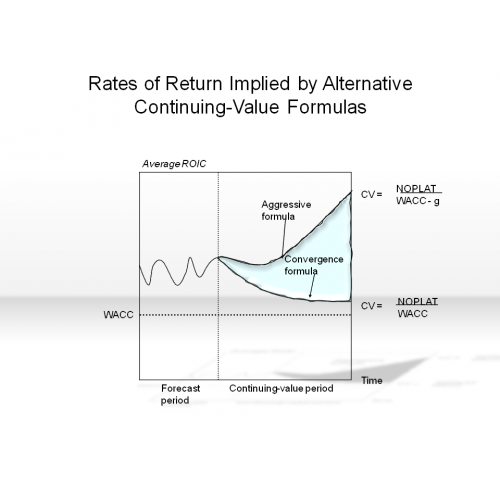
Rates of Return Implied by Alternative Continuing-Value Formulas
$3.00
Reshaping the Pyramid
$3.00

ROI for Portals
$3.00

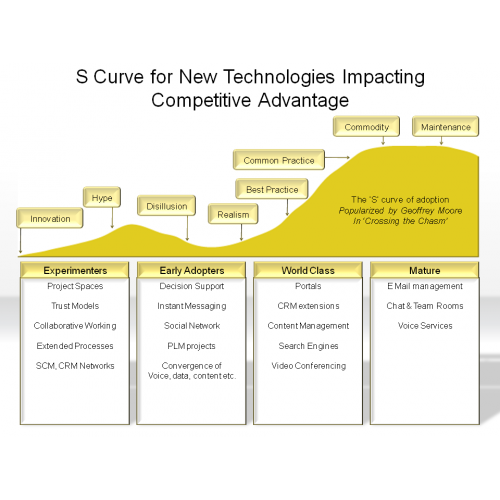
S Curve for New Technologies Impacting Competitive Advantage
$3.00
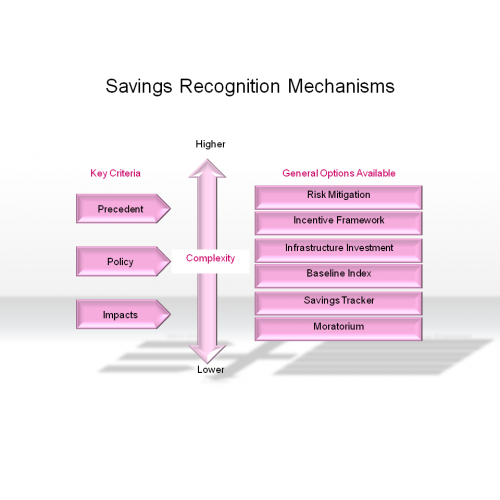
Savings Recognition Mechanisms
$3.00
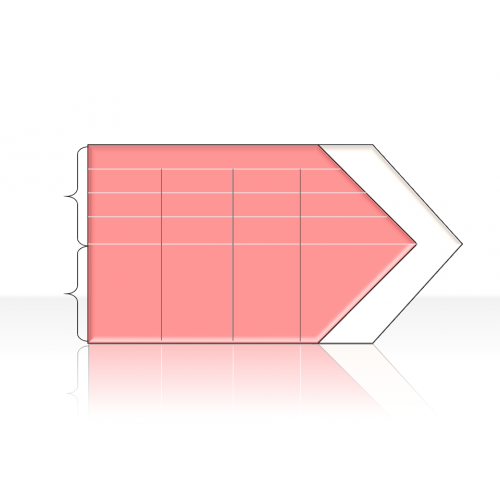
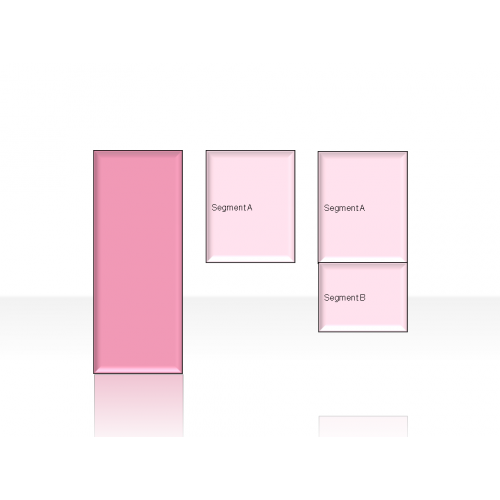
Segmentation Diagrams 2.5.3.13
$2.00

Set & Subset Diagram 2.3.4.13
$2.00

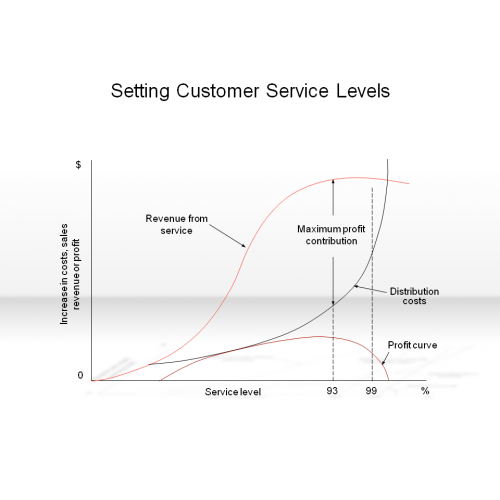
Setting Customer Service Levels
$3.00
Square & Cubes 2.3.6.13
$2.00

Stakeholders in the energy industry
$3.00

Stars & Comb Diagram 2.3.5.13
$2.00

Table Diagrams 2.7.13
$2.00
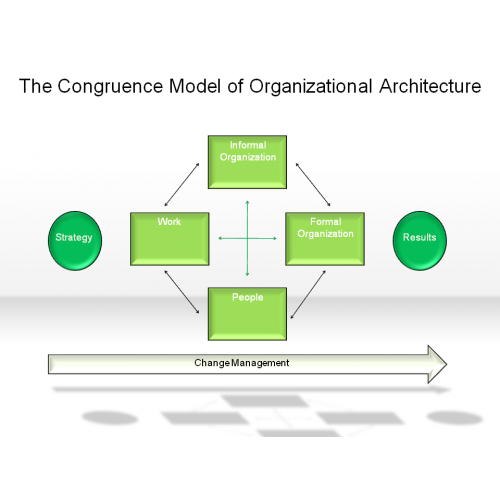
The Congruence Model of Organizational Architecture
$3.00
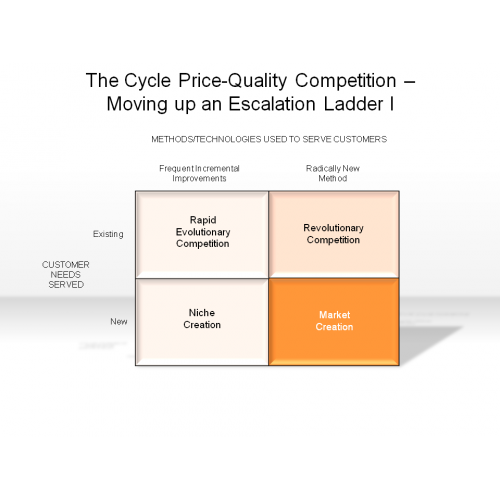
The Cycle Price-Quality Competition - Moving up an Escalation Ladder I
$3.00
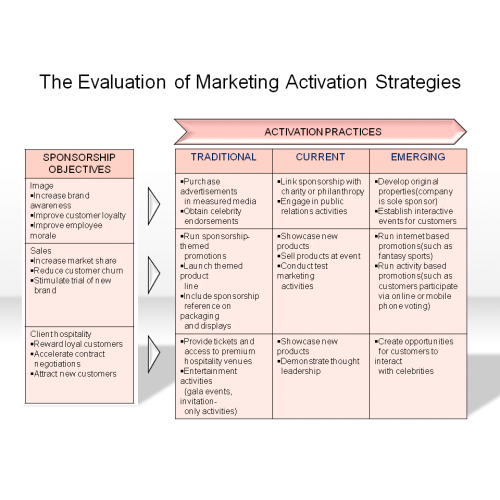
The Evaluation of Marketing Activation Strategies
$3.00