
Search


")


Search Criteria
Search:
Products meeting the search criteria
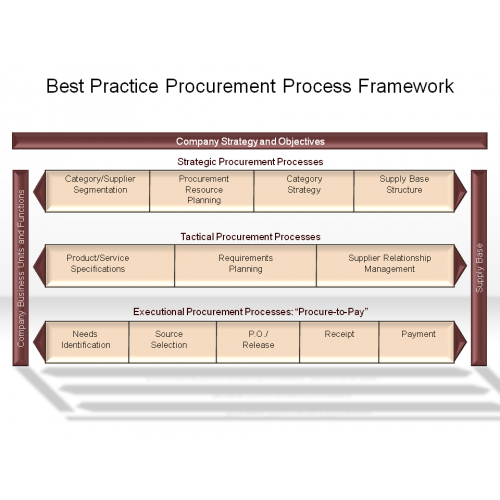
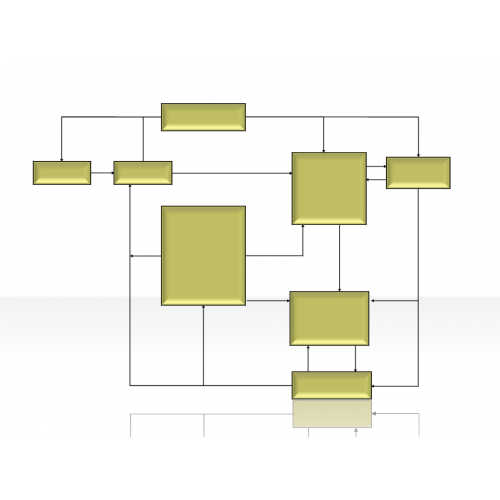
Best Practice Procurement Process Framework
$3.00
business captain 4.3.1.15
$2.00

business champ 4.3.2.15
$2.00
business chief 4.3.3.15
$2.00
business chief 4.3.4.15
$2.00
business executive 4.3.5.15
$2.00
business expert 4.3.6.15
$2.00
business head 4.3.7.15
$2.00
business king 4.3.8.15
$2.00
business man 4.3.9.15
$2.00
business master 4.3.10.15
$2.00
business one 4.3.11.15
$2.00
business power 4.3.12.15
$2.00
business principle 4.3.13.15
$2.00
business star 4.3.14.15
$2.00
business success 4.3.15.15
$2.00
Circle Diagram 2.3.2.15
$2.00

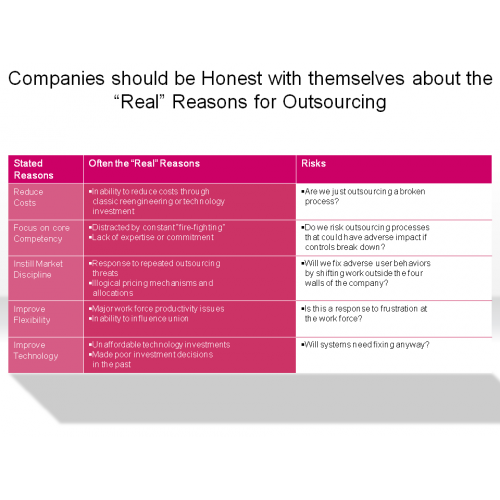
Companies should be Honest with themselves about the “Real” Reasons for Outsourcing
$3.00
Convergence Diagrams 2.5.1.15
$2.00
Cross Diagram 2.3.3.15
$2.00
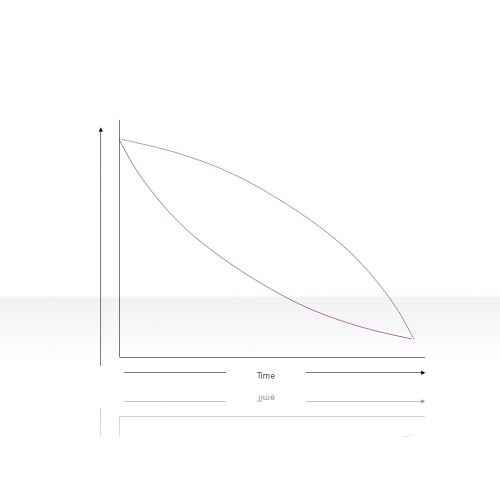
Curve Diagram 2.2.5.15
$2.00
cycle diagram 2.1.2.15
$2.00

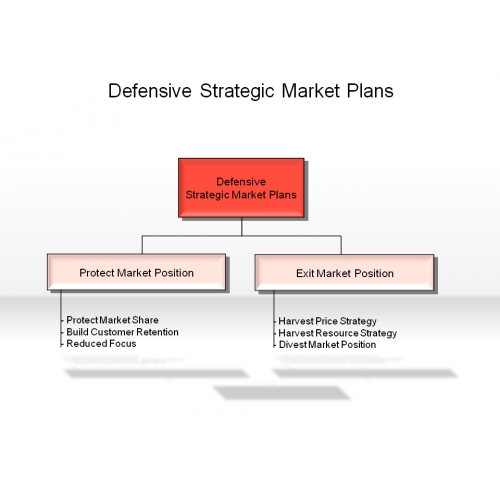
Defensive Strategic Market Plans
$3.00
Defining Small Business
$3.00

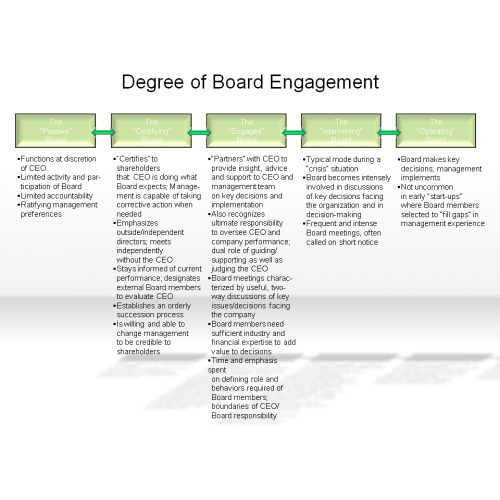
Degree of Board Engagement
$3.00
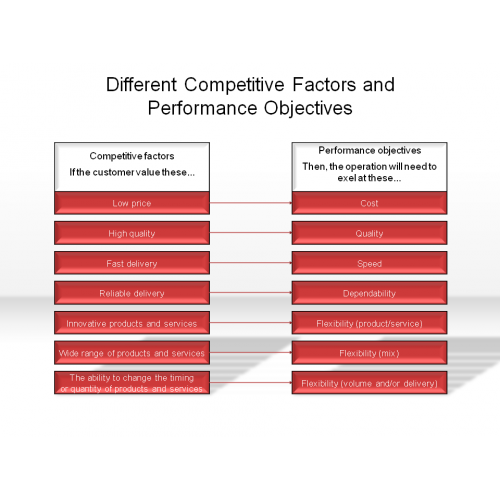
Different Competitive Factors and Performance Objectives
$3.00
DMS Mapped out the Required Organizational Shift
$3.00

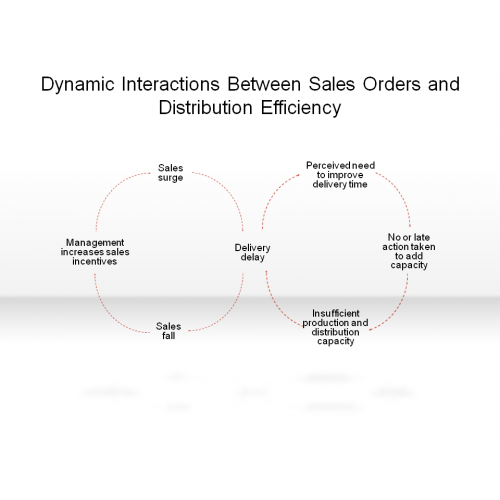
Dynamic Interactions Between Sales Orders and Distribution Efficiency
$3.00
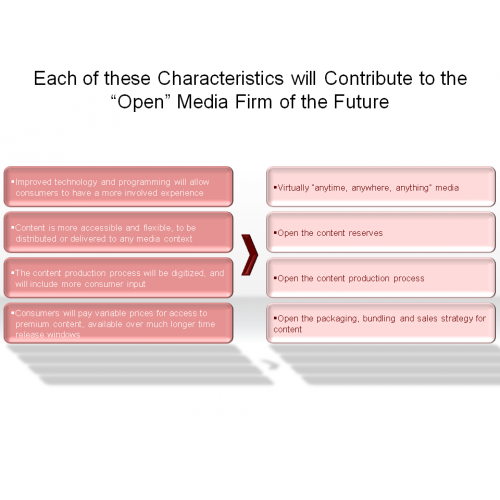
Each of these Characteristics will Contribute to the “Open” Media Firm of the Future
$3.00
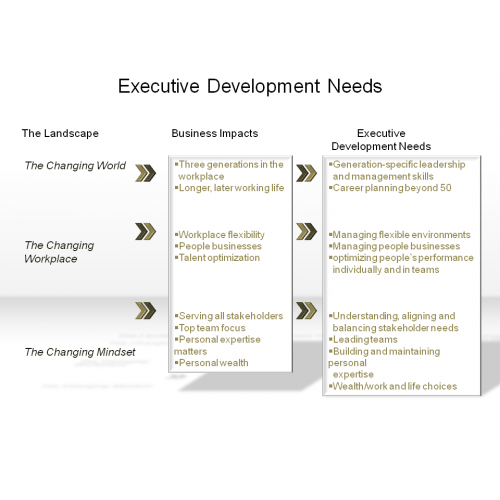
Executive Development Needs
$3.00
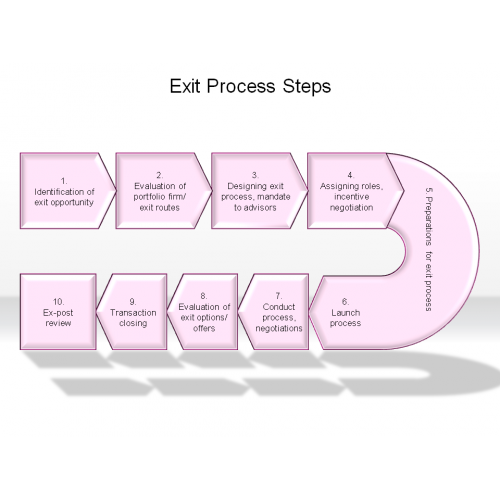
Exit Process Steps
$3.00
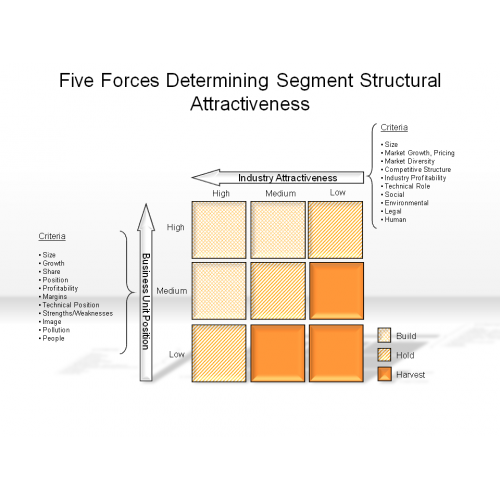
Five Forces Determining Segment Structural Attractiveness
$3.00
flow diagram 2.1.1.15
$2.00
Focused M&A Activity
$3.00

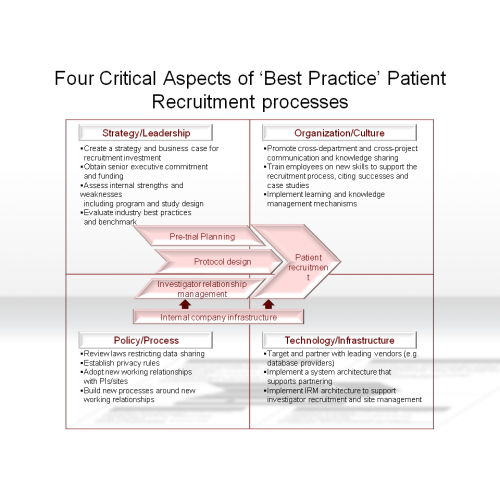
Four Critical Aspects of ‘Best Practice’ Patient Recruitment processes
$3.00


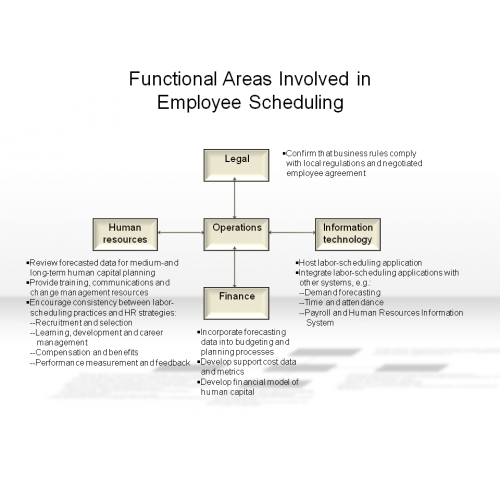
Functional Areas Involved in Employee Scheduling
$3.00
Future “profit zones” in retail financial services will match scope of offering with customer segments
$3.00

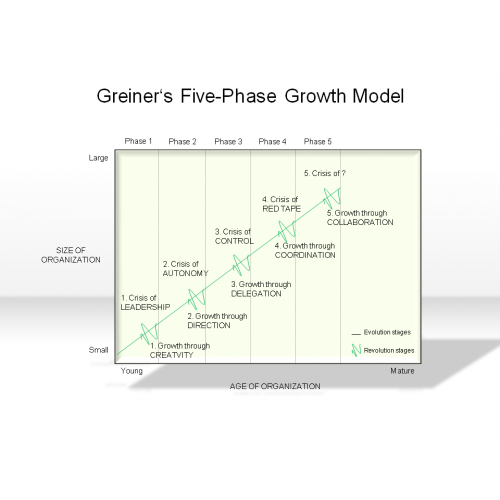
Greiner's Five-Phase Growth Model
$3.00
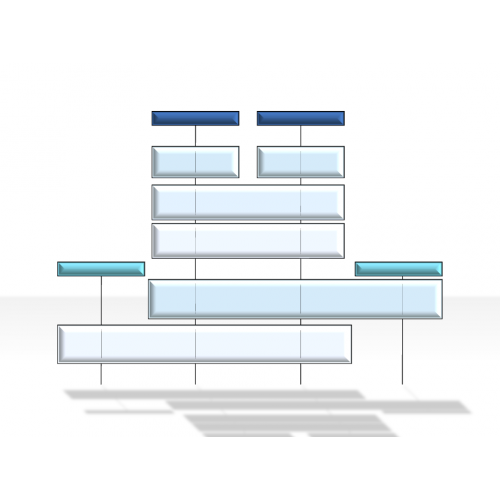
Hierarchy Diagrams 2.6.15
$2.00

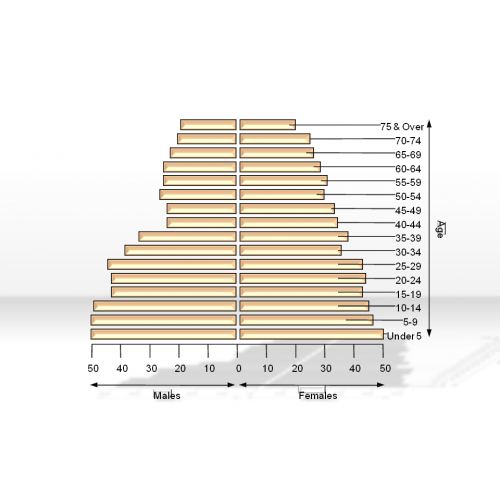
Histogram 2.2.4.15
$2.00
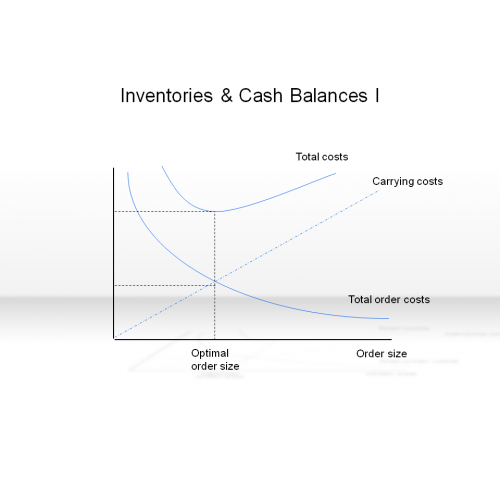
Inventories & Cash Balances I
$3.00
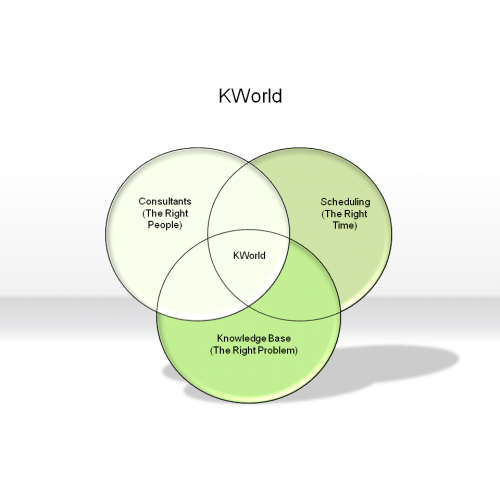
Kworld
$3.00
Line Diagram 2.2.6.15
$2.00
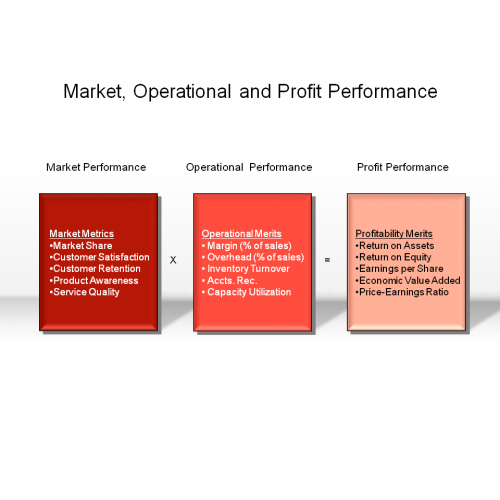
Market, Operational and Profit Performance
$3.00
network diagram 2.1.3.15
$2.00
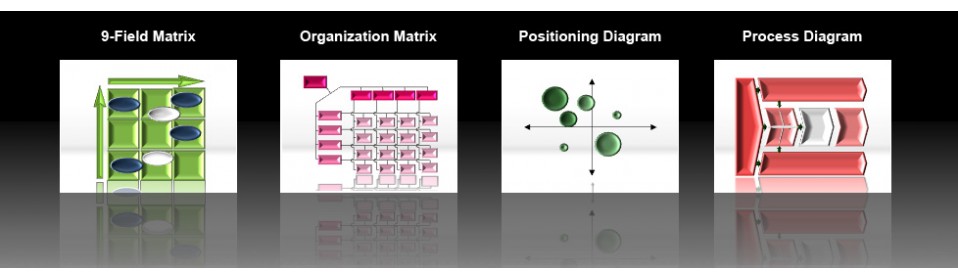
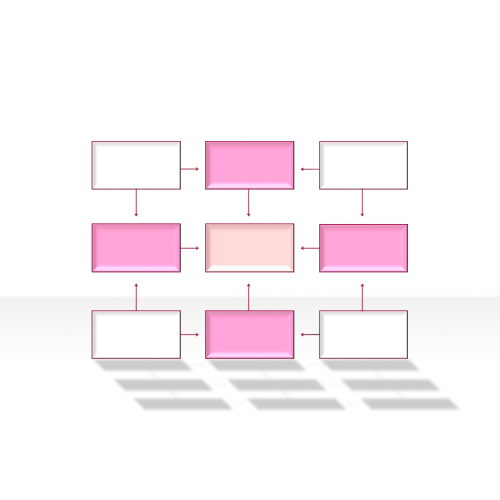
Organization Matrix 2.4.3.15
$2.00
Performance - Based Pricing
$3.00

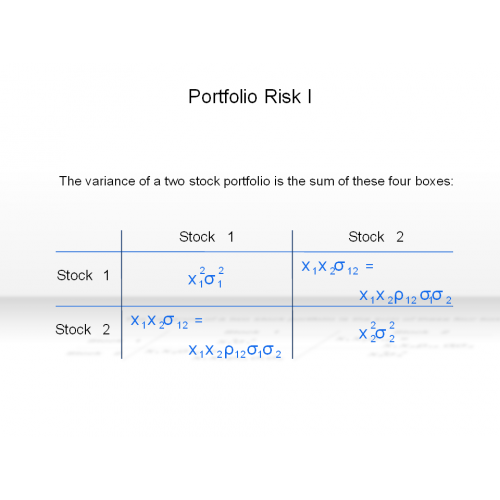
Portfolio Risk I
$3.00
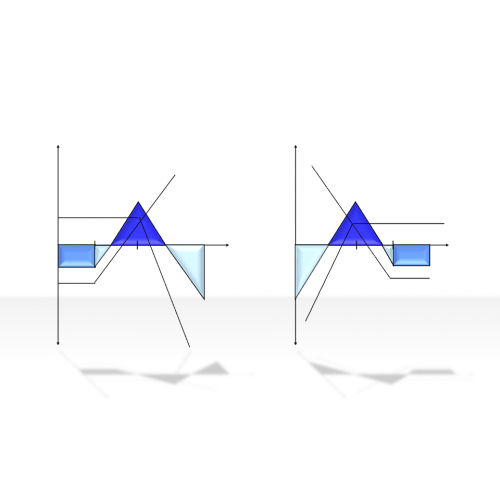
Positioning Diagrams 2.5.2.15
$2.00
process diagram 2.1.4.15
$2.00
Profitability Ratios II
$3.00

Proportion Diagrams 2.5.4.15
$2.00
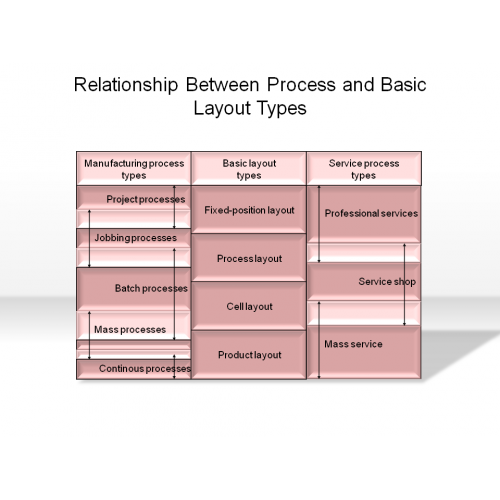
Relationship Between Process and Basic Layout Types
$3.00
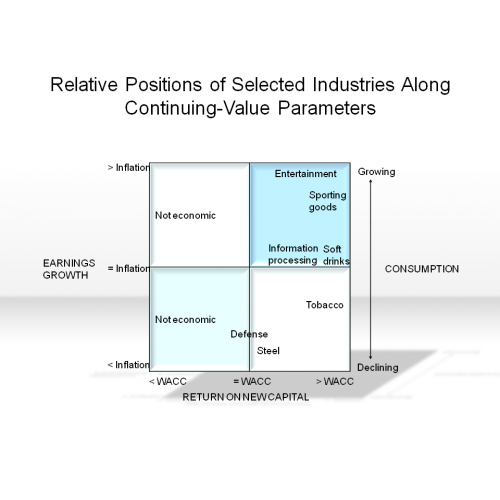
Relative Positions of Selected Industries Along Continuing-Value Parameters
$3.00
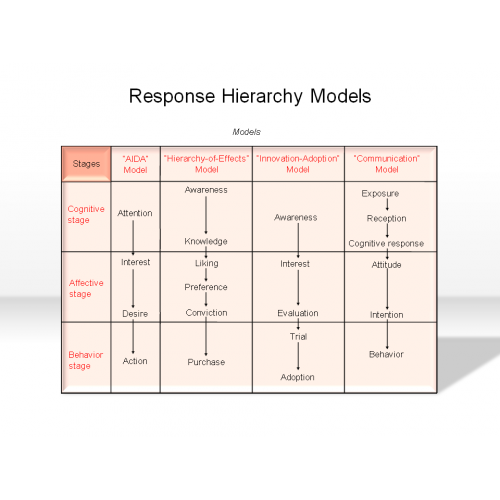
Response Hierarchy Models
$3.00
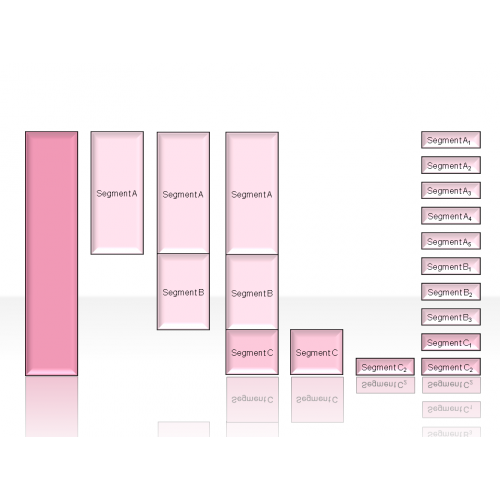
Segmentation Diagrams 2.5.3.15
$2.00
Set & Subset Diagram 2.3.4.15
$2.00

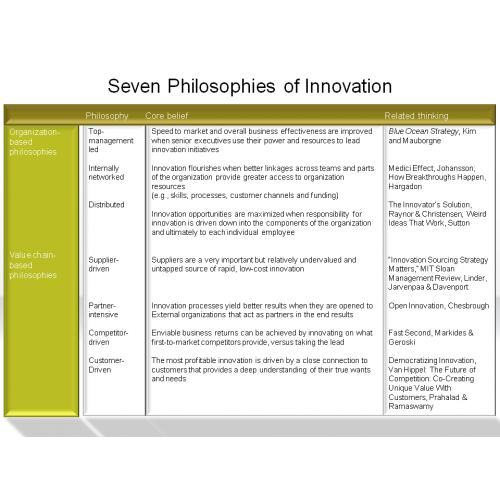
Seven Philosophies of Innovation
$3.00
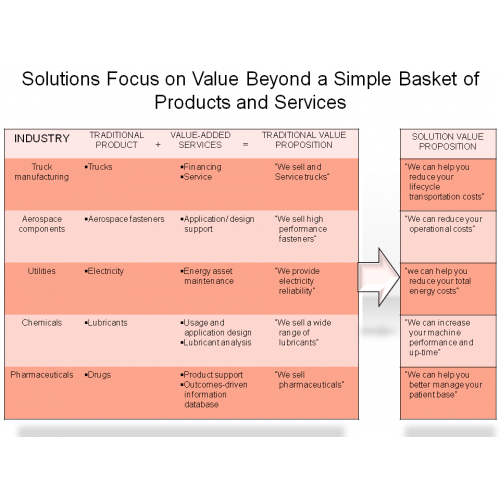
Solutions Focus on Value Beyond a Simple Basket of Products and Services
$3.00
Square & Cubes 2.3.6.15
$2.00

Stars & Comb Diagram 2.3.5.15
$2.00

Structures to Deal with Residual Interdependencies
$3.00
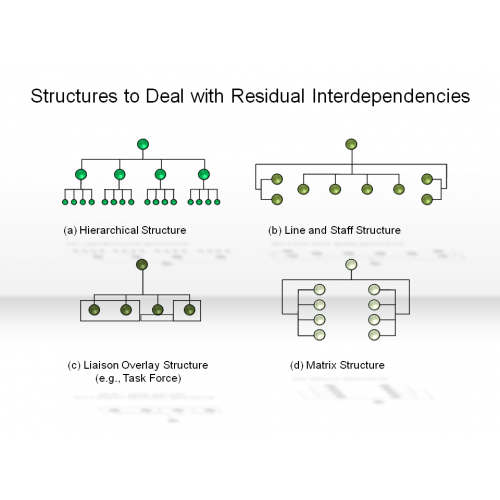
Table Diagrams 2.7.15
$2.00
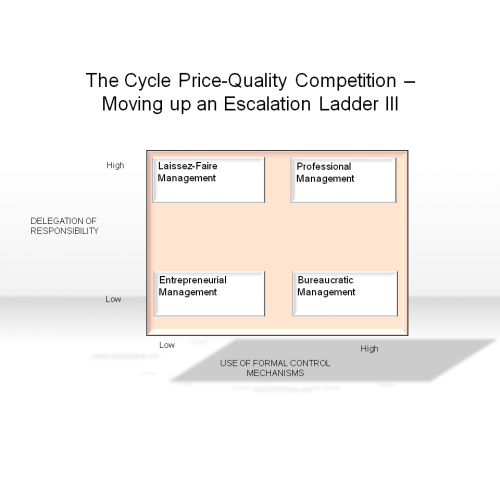
The Cycle Price-Quality Competition - Moving up an Escalation Ladder III
$3.00
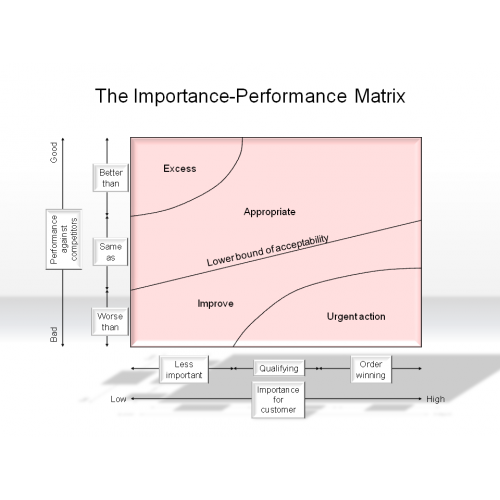
The Importance-Performance Matrix
$3.00
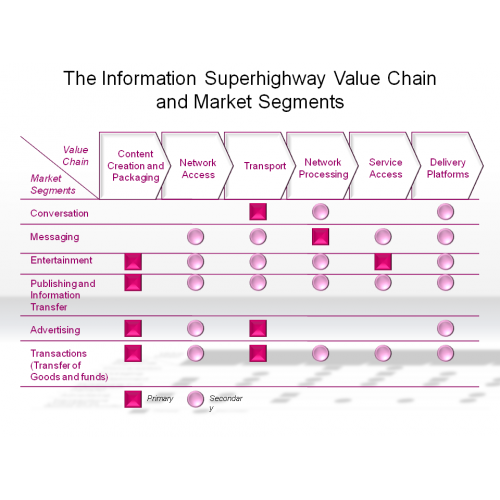
The Information Superhighway Value Chain and Market Segments
$3.00
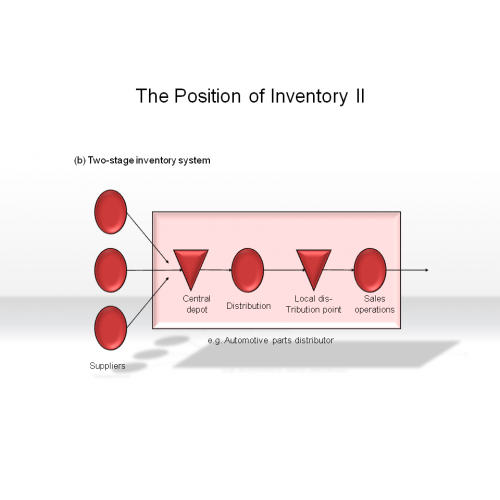
The Position of Inventory II
$3.00
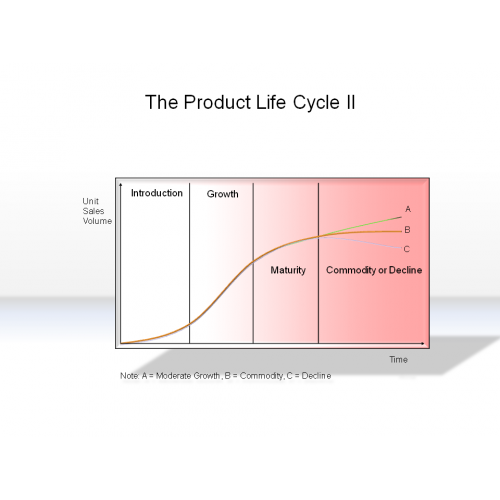
The Product Life Cycle II
$3.00
The Route to Enterprise Resilience
$3.00

Triangle & Pyramids 2.3.1.15
$2.00

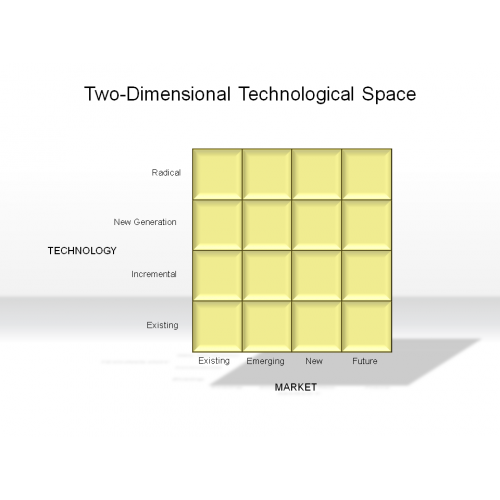
Two-Dimensional Technological Space
$3.00
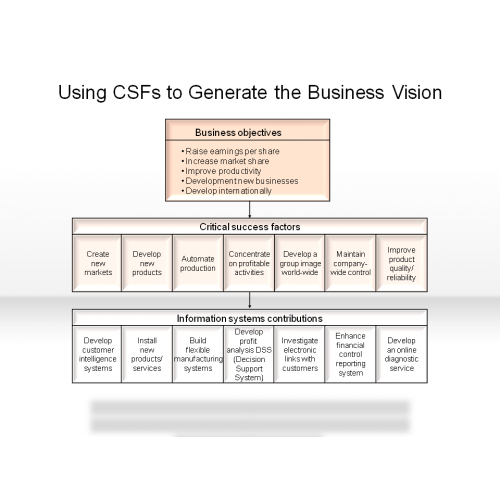
Using CSF's to Generate the Business Vision
$3.00
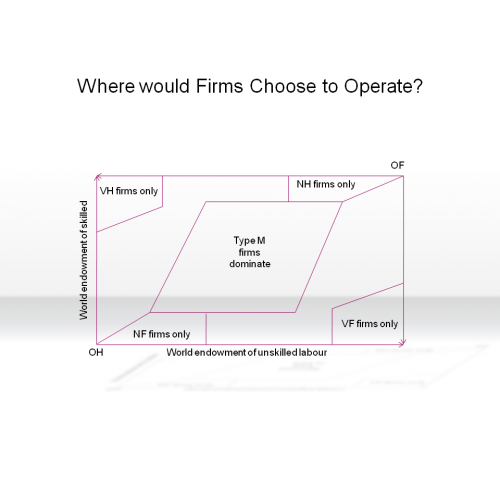
Where would Firms Choose to Operate?
$3.00
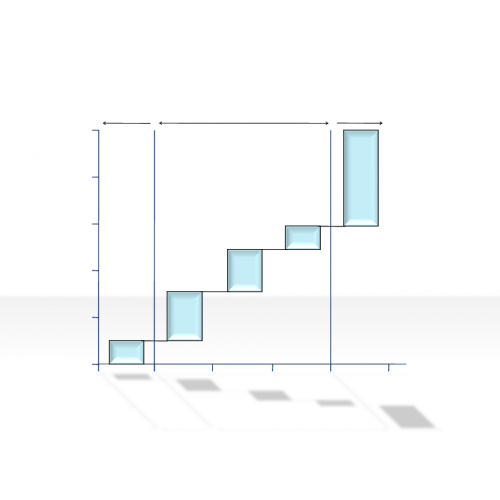
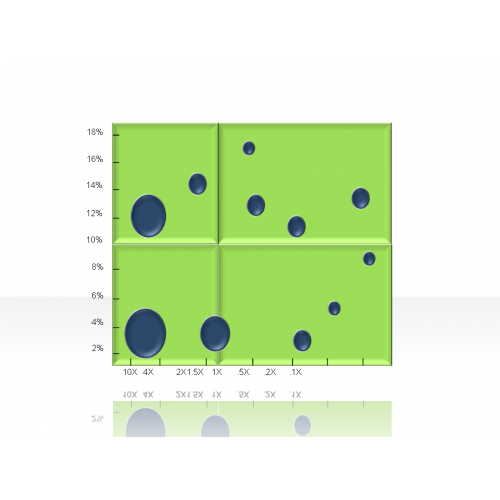
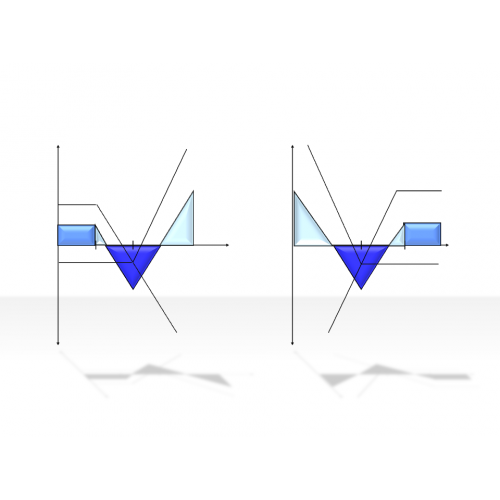
2-Axis diagram 2.2.1.16
$2.00
4-Axis diagram 2.2.2.16
$2.00
4-Field Matrix 2.4.1.16
$2.00

9-Field Matrix 2.4.2.16
$2.00

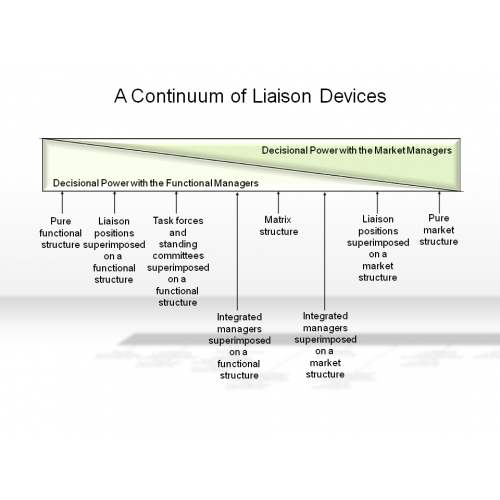
A Continuum of Liaison Devices
$3.00
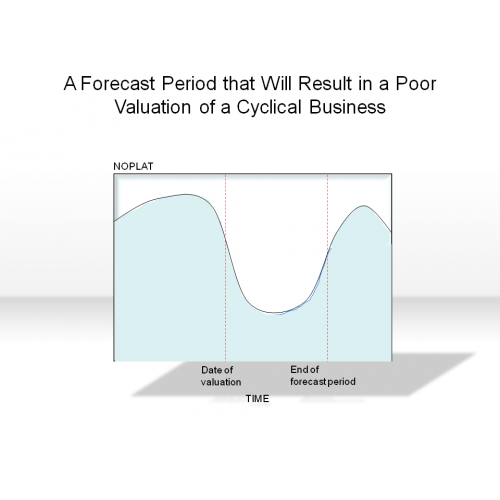
A Forecast Period that Will Result in a Poor Valuation of a Cyclical Business
$3.00
Attitude Based Decision Process: AIDA (Attention, Interest, Desire, Action)
$3.00

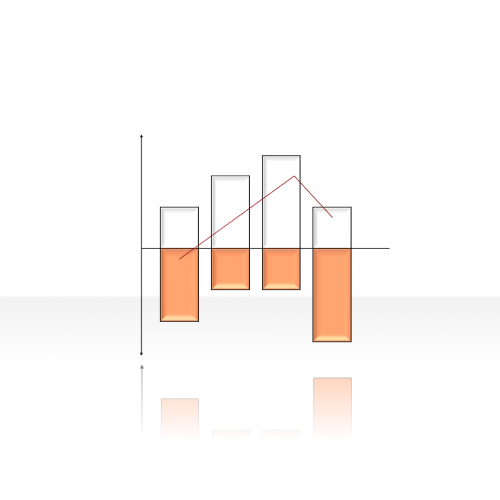
Bar diagram 2.2.3.16
$2.00
Basic Business Model 3.1.2.16
$2.00
Board-Building Framework
$3.00

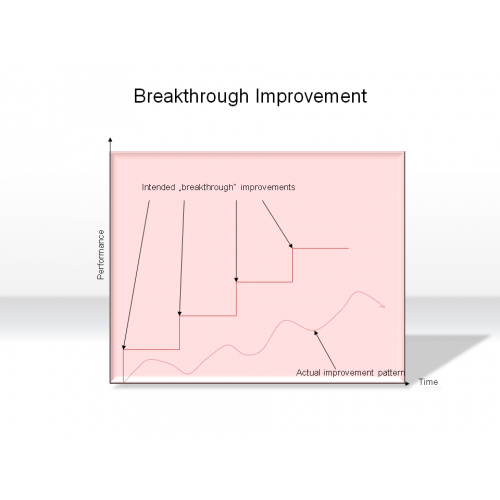
Breakthrough Improvement
$3.00
business captain 4.3.1.16
$2.00
business champ 4.3.2.16
$2.00

business chief 4.3.3.16
$2.00
business chief 4.3.4.16
$2.00
business expert 4.3.6.16
$2.00
business head 4.3.7.16
$2.00
business king 4.3.8.16
$2.00
business man 4.3.9.16
$2.00
business master 4.3.10.16
$2.00
business one 4.3.11.16
$2.00

business power 4.3.12.16
$2.00