
Search


Search Criteria
Search:
Products meeting the search criteria
process diagram 2.1.4.18
$2.00

Procurement Integration Teams
$3.00

Proportion Diagrams 2.5.4.18
$2.00

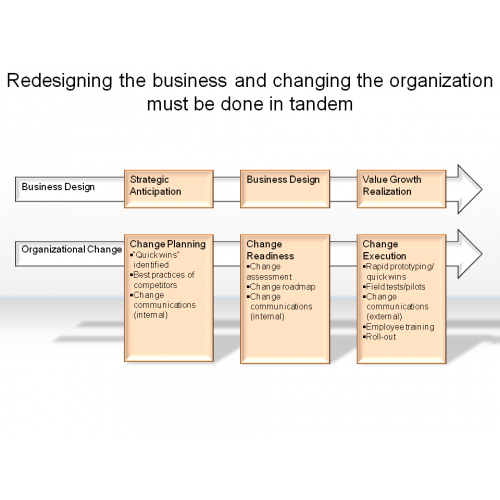
Redesigning the business and changing the organization must be done in tandem
$3.00
Segmentation Diagrams 2.5.3.18
$2.00

Set & Subset Diagram 2.3.4.18
$2.00

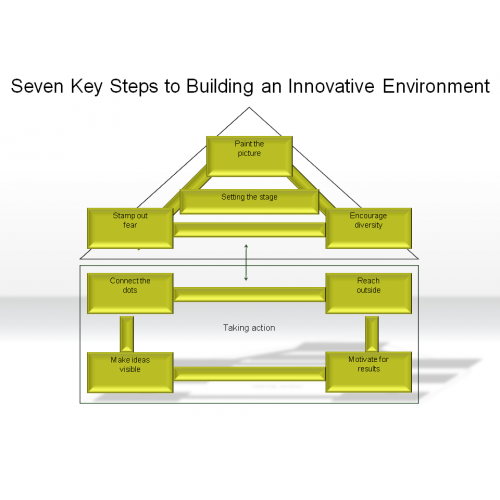
Seven Key Steps to Building an Innovative Environment
$3.00
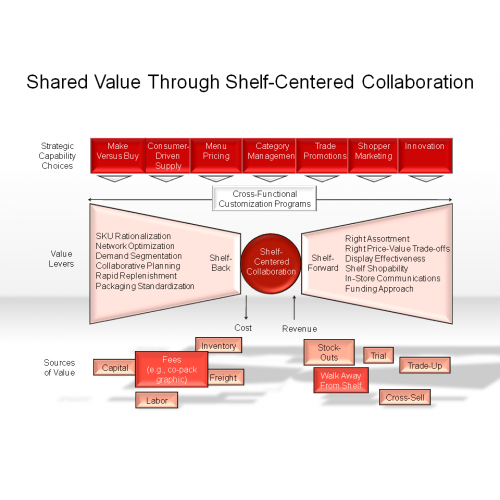
Shared Value Through Shelf-Centered Collaboration
$3.00
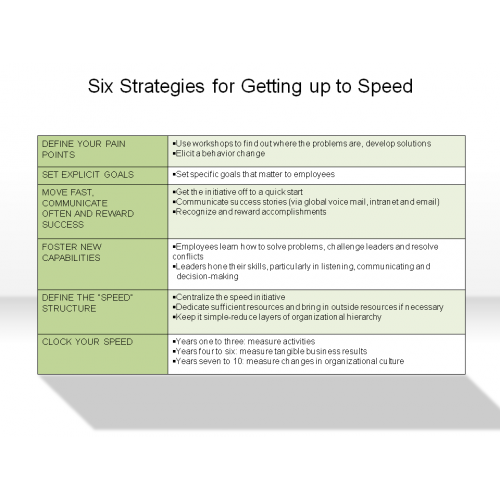
Six Strategies for Getting up to Speed
$3.00
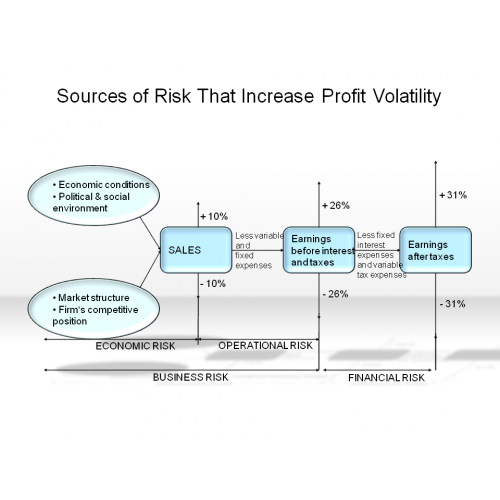
Sources of Risk that Increase Profit Volatility
$3.00
Square & Cubes 2.3.6.18
$2.00

Stars & Comb Diagram 2.3.5.18
$2.00

Supply and Demand for Domestic Currency
$3.00
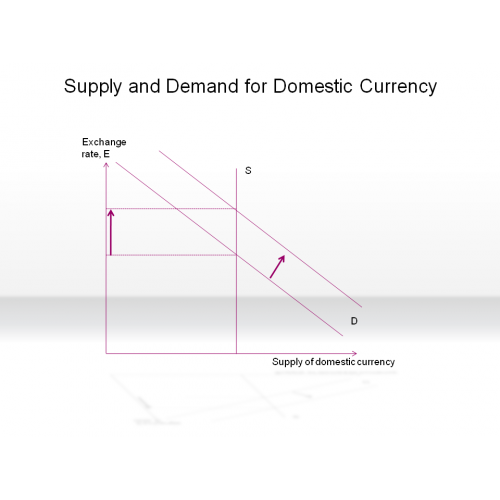
Table Diagrams 2.7.18
$2.00

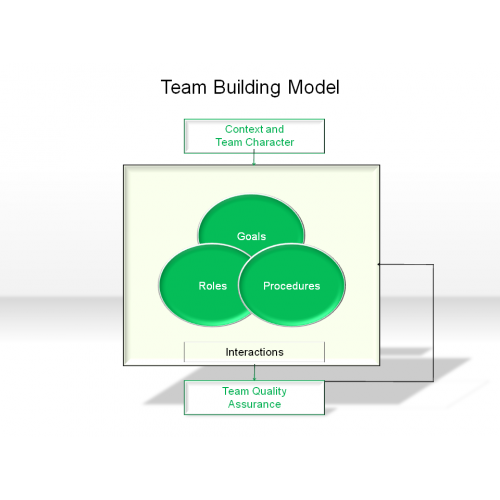
Team Building Model
$3.00
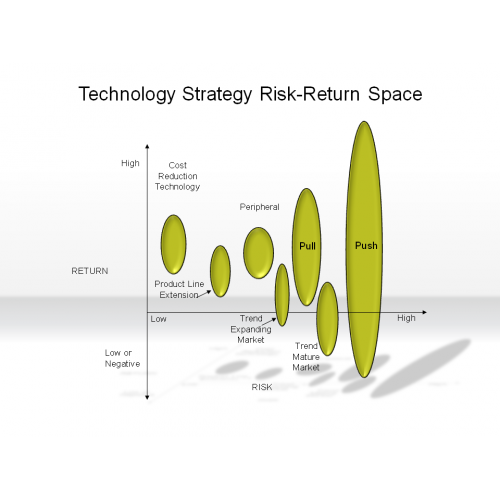
Technology Strategy Risk-Return Space
$3.00
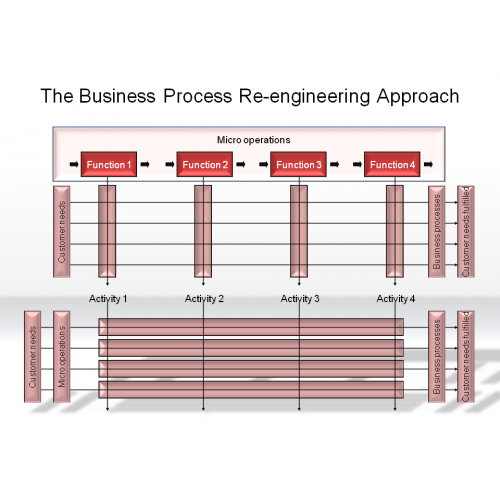
The Business Process Re-engineering Approach
$3.00
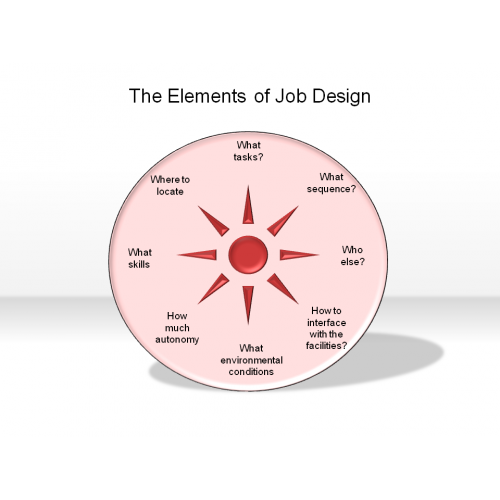
The Elements of Job Design
$3.00
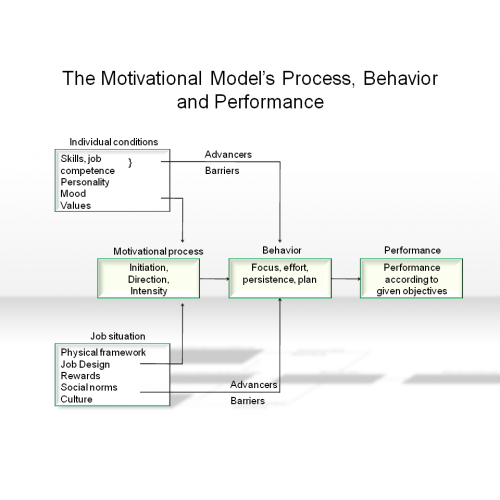
The Motivational Model’s Process, Behavior and Performance
$3.00
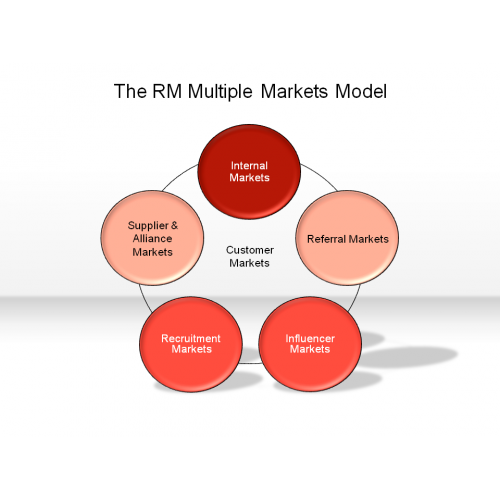
The RM Multiple Markets Model
$3.00
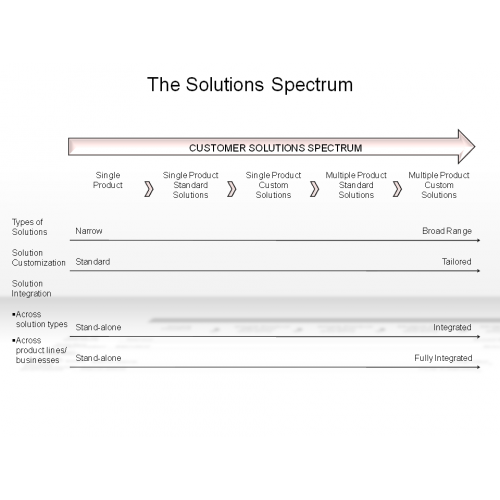
The Solutions Spectrum
$3.00
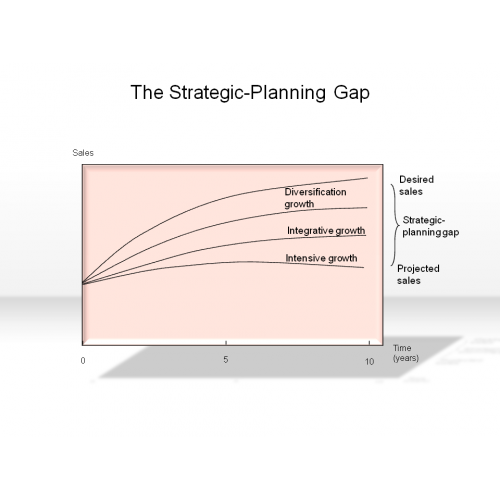
The Strategic-Planning Gap
$3.00
The Wheel of Competitive Strategy
$3.00

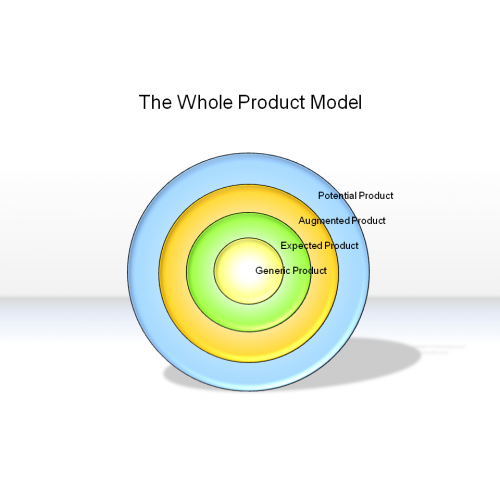
The Whole Product Model
$3.00
Triangle & Pyramids 2.3.1.18
$2.00

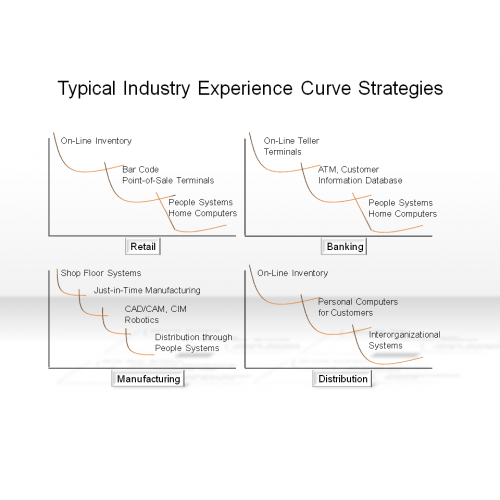
Typical Industry Experience Curve Strategies
$3.00
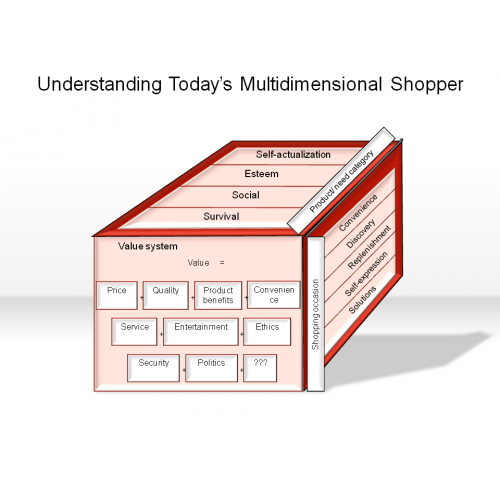
Understanding Today's Multidimensional Shopper
$3.00
What is Your Future Demand and How does it Matter Today?
$3.00

2-Axis diagram 2.2.1.19
$2.00
4-Axis diagram 2.2.2.19
$2.00

4-Field Matrix 2.4.1.19
$2.00

9-Field Matrix 2.4.2.19
$2.00
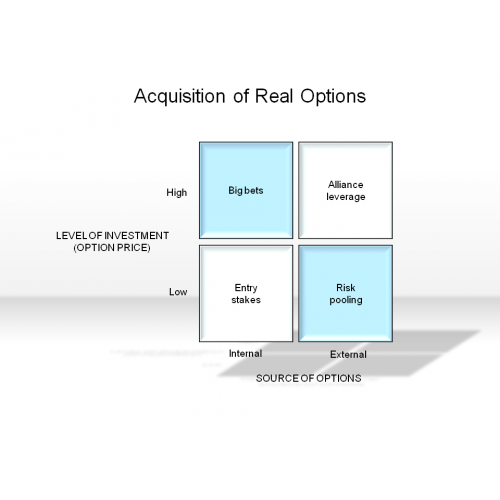
Acquisition of Real Options
$3.00
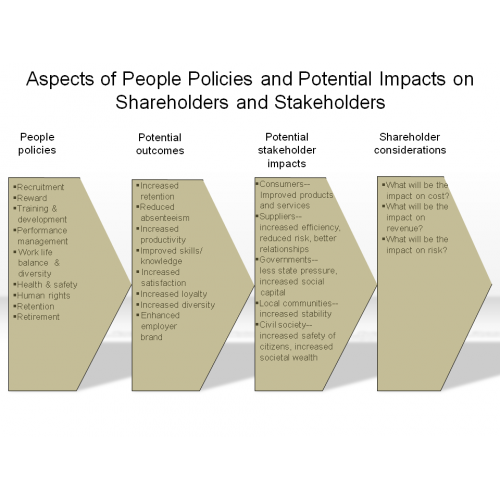
Aspects of People Policies and Potential Impacts on Shareholders and Stakeholders
$3.00
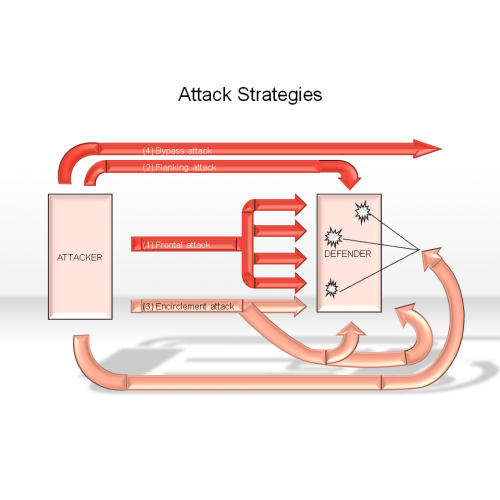
Attack Strategies
$3.00
Axes of uncertainty and the possibility space
$3.00

Bar diagram 2.2.3.19
$2.00

Basic Business Model 3.1.2.19
$2.00

business captain 4.3.1.19
$2.00

business champ 4.3.2.19
$2.00

business chief 4.3.3.19
$2.00
business chief 4.3.4.19
$2.00
business executive 4.3.5.19
$2.00

business expert 4.3.6.19
$2.00
business head 4.3.7.19
$2.00
business king 4.3.8.19
$2.00
business man 4.3.9.19
$2.00
business master 4.3.10.19
$2.00
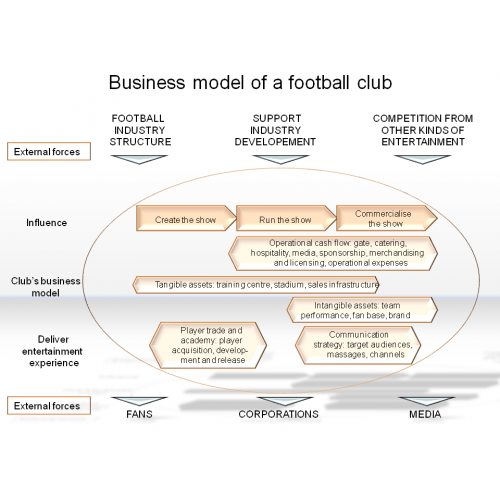
Business model of a football club
$3.00
business one 4.3.11.19
$2.00
business power 4.3.12.19
$2.00
business principle 4.3.13.19
$2.00
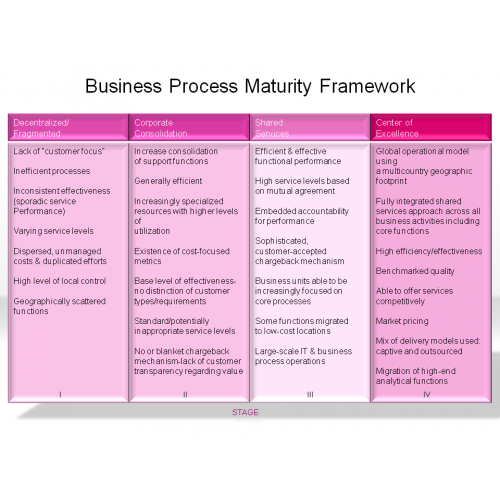
Business Process Maturity Framework
$3.00
business star 4.3.14.19
$2.00
business success 4.3.15.19
$2.00

Circle Diagram 2.3.2.19
$2.00

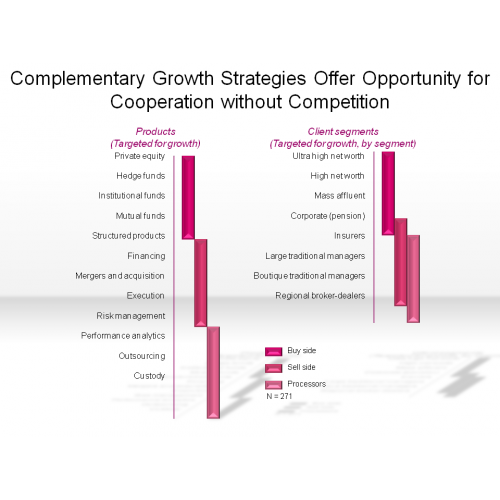
Complementary Growth Strategies Offer Opportunity for Cooperation without Competition
$3.00
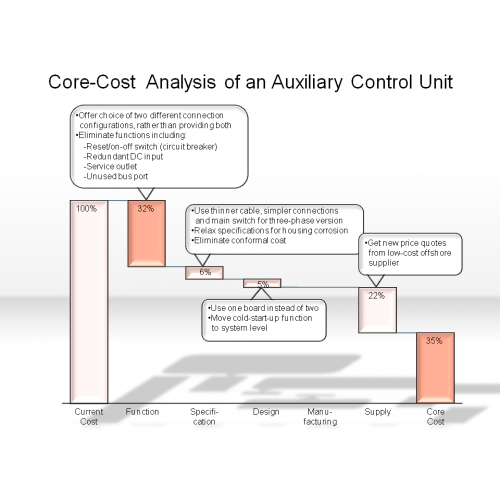
Core-Cost Analysis of an Auxiliary Control Unit
$3.00
Curve Diagram 2.2.5.19
$2.00

cycle diagram 2.1.2.19
$2.00

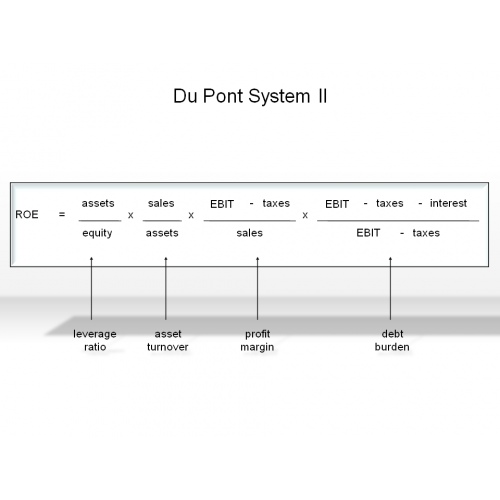
Du Pont System II
$3.00
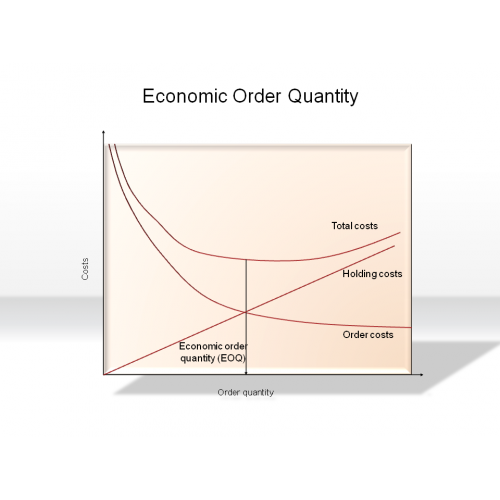
Economic Order Quantity
$3.00
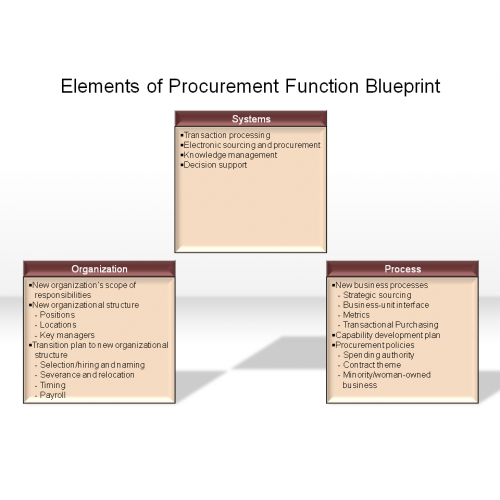
Elements of Procurement Function Blueprint
$3.00
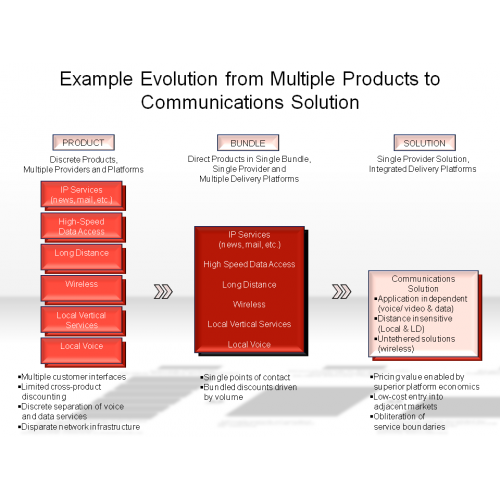
Example Evolution from Multiple Products to Communications Solution
$3.00
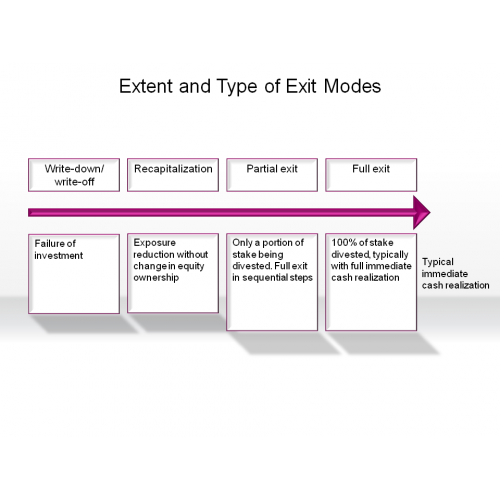
Extent and Type of Exit Modes
$3.00
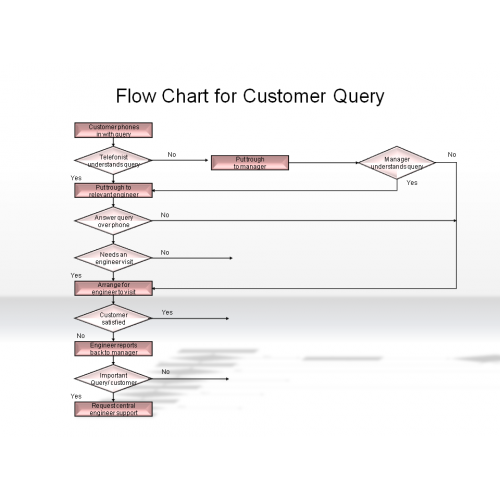
Flow Chart for Customer Query
$3.00
flow diagram 2.1.1.19
$2.00
Forces That Shape Segment Attractiveness
$3.00

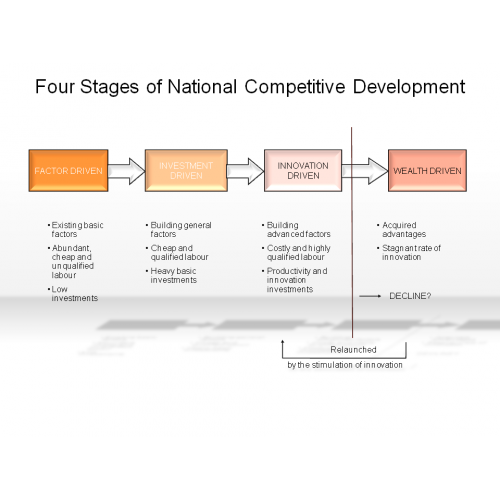
Four Stages of National Competitive Development
$3.00


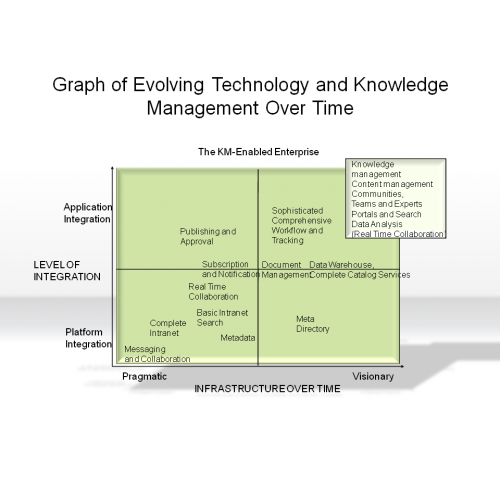
Graph of Evolving Technology and Knowledge Management Over Time
$3.00
Hierarchy Diagrams 2.6.19
$2.00
Histogram 2.2.4.19
$2.00
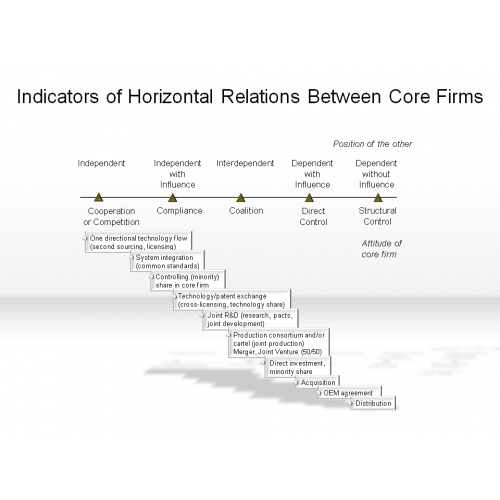
Indicators of Horizontal Relations Between Core Firms
$3.00
Line Diagram 2.2.6.19
$2.00

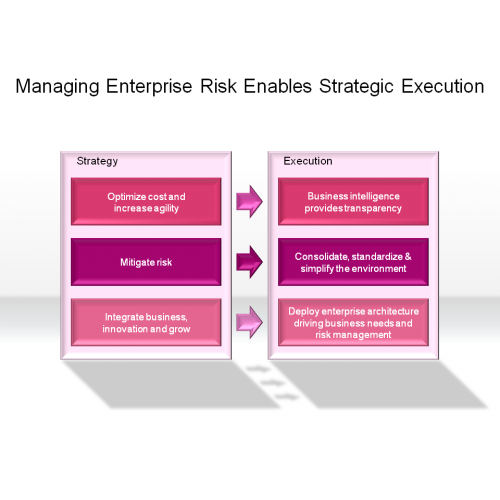
Managing Enterprise Risk Enables Strategic Execution
$3.00
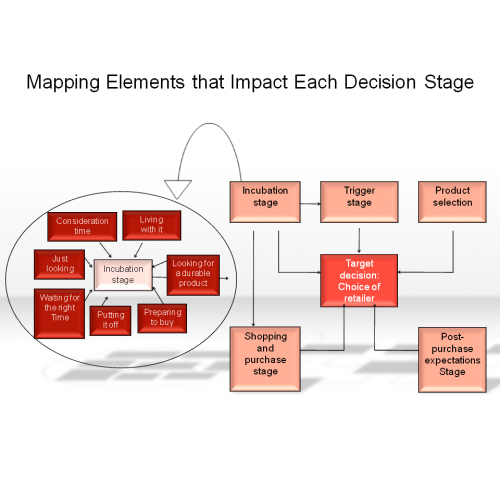
Mapping Elements that Impact Each Decision Stage
$3.00
Markowitz Portfolio Theory
$3.00

network diagram 2.1.3.19
$2.00

Organization Matrix 2.4.3.19
$2.00

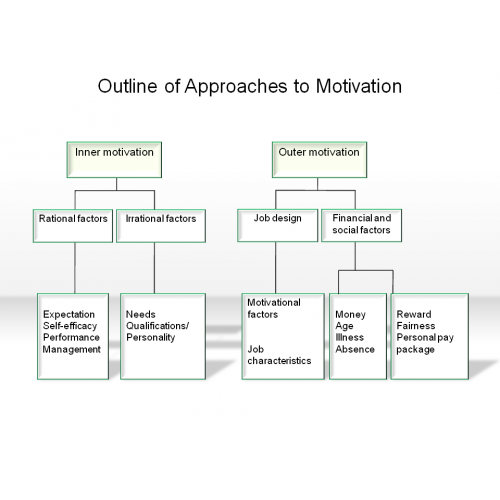
Outline of Approaches to Motivation
$3.00
Positioning Diagrams 2.5.2.19
$2.00

process diagram 2.1.4.19
$2.00

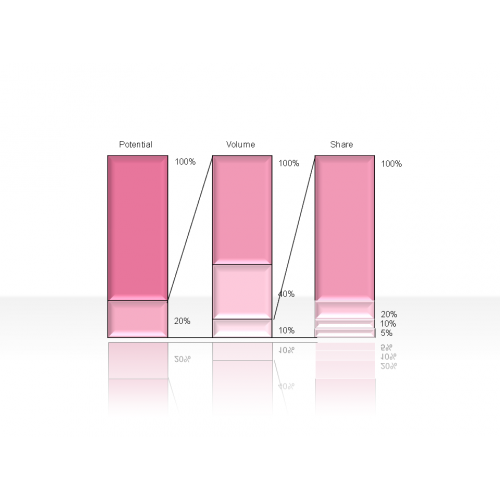
Proportion Diagrams 2.5.4.19
$2.00
Sales of a Drug Usually Peak about 10 Years after it has Reached the Market
$3.00

Segmentation Diagrams 2.5.3.19
$2.00
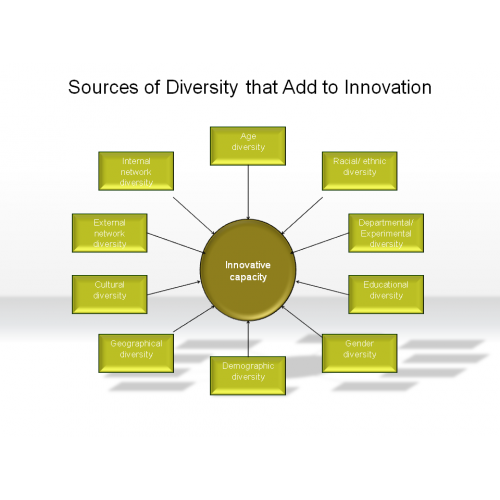
Sources of Diversity that Add to Innovation
$3.00
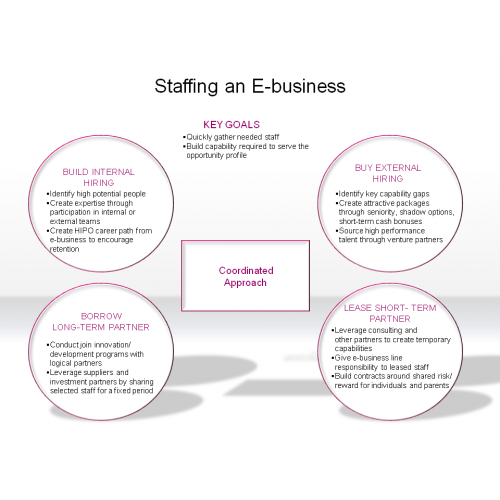
Staffing an E-business
$3.00
Status Report on Brand Activity in M&A Deals
$3.00
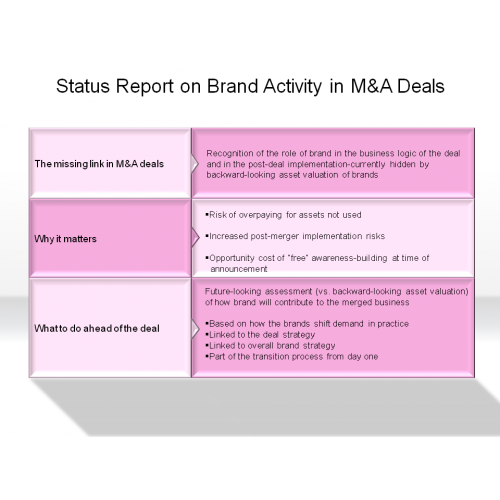
Table Diagrams 2.7.19
$2.00

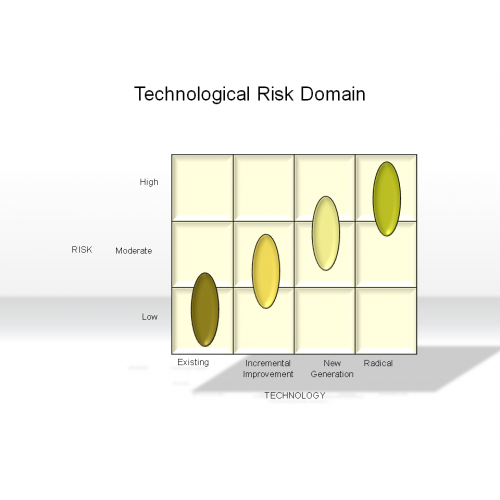
Technological Risk Domain
$3.00
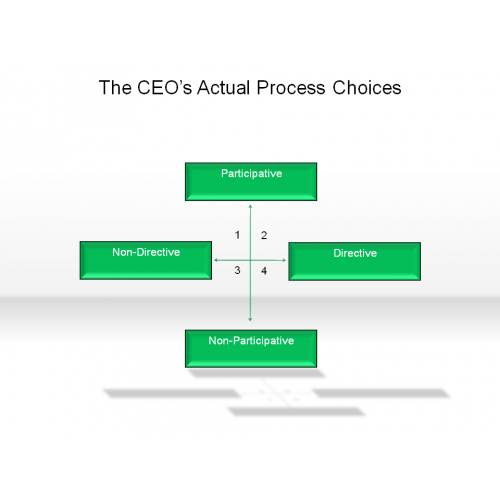
The CEO's Actual Process Choices
$3.00
The Chronology of the Differente Approaches to Job Design
$3.00

The Effect Increased Supply of Foreign Currency in a Floating-Rate Regime
$3.00

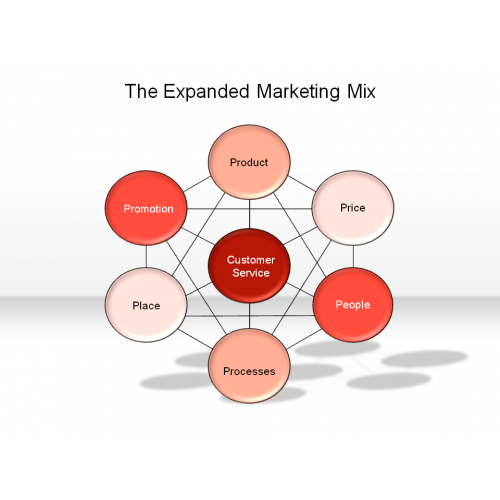
The Expanded Marketing Mix
$3.00
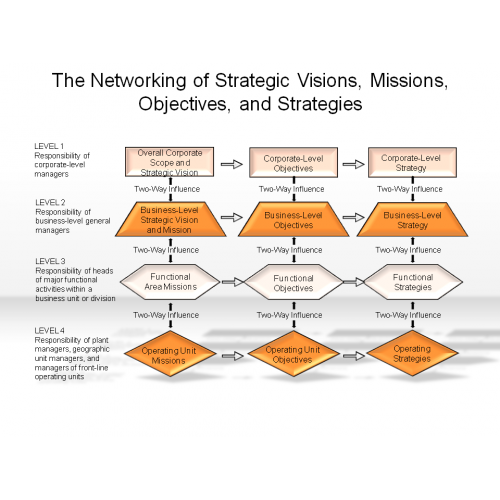
The Networking of Strategic Visions, Missions, Objectives and Strategies
$3.00