

Search


Search Criteria
Search:
Products meeting the search criteria
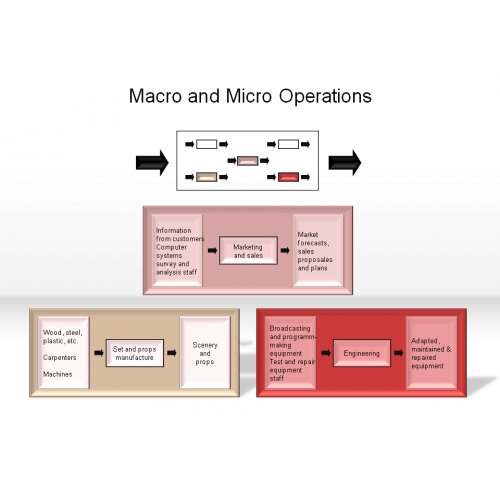
Macro and Micro Operations
$3.00
Market Driving Capabilities Framework
$3.00

Market Potential, Sales Potential, and Sales Forecast
$3.00

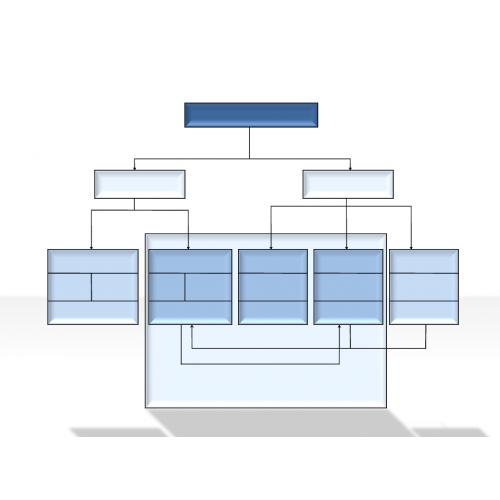
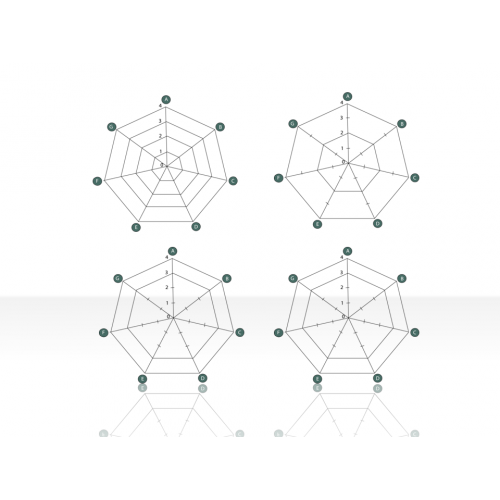
network diagram 2.1.3.5
$2.00

New Ways for HR to Create Value II
$3.00

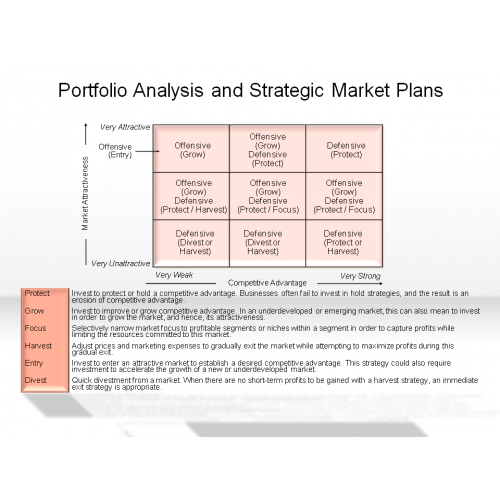
Portfolio Analysis and Strategic Market Plans
$3.00
Positioning Diagrams 2.5.2.5
$2.00
Pressures Driving the Need to Innovate
$3.00

process diagram 2.1.4.5
$2.00
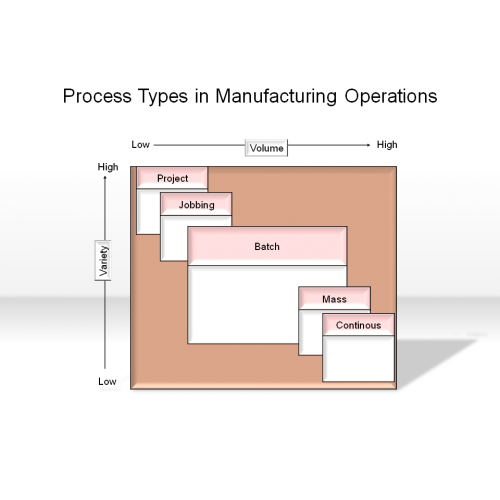
Process Types in Manufacturing Operations
$3.00
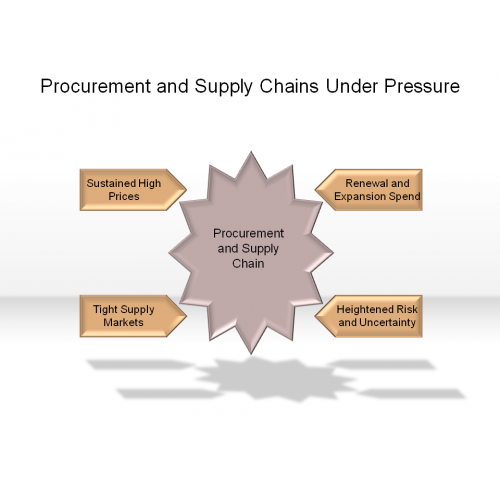
Procurement and Supply Chains Under Pressure
$3.00
Proportion Diagrams 2.5.4.5
$2.00
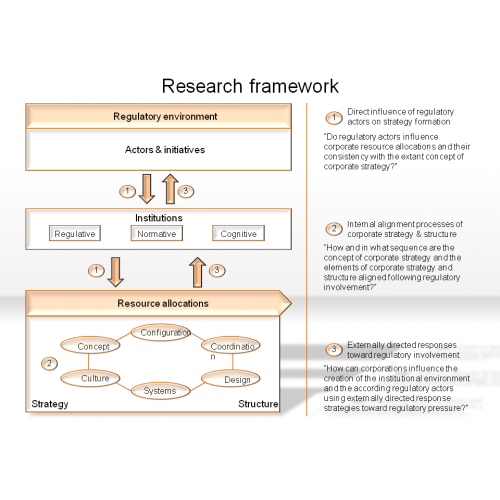
Research framework
$3.00
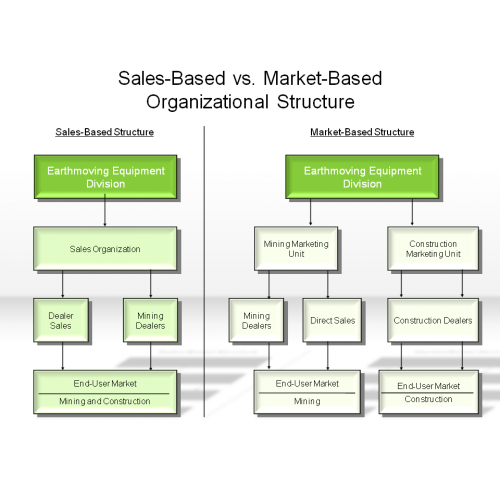
Sales-Based vs. Market-Based Organizational Structure
$3.00
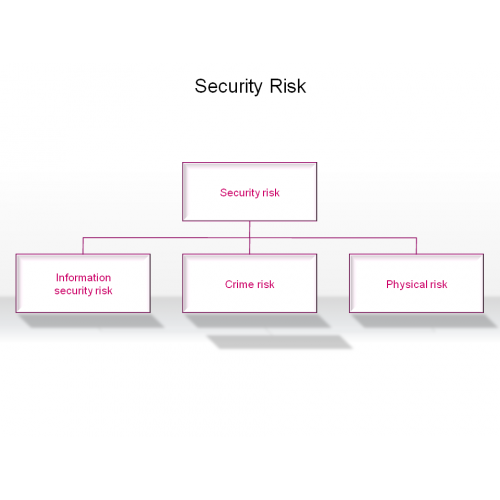
Security Risk
$3.00
Segmentation Diagrams 2.5.3.5
$2.00

Set & Subset Diagram 2.3.4.5
$2.00

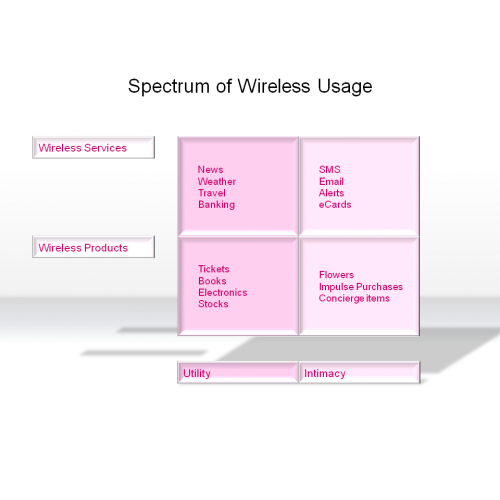
Spectrum of Wireless Usage
$3.00
Square & Cubes 2.3.6.5
$2.00

Stars & Comb Diagram 2.3.5.5
$2.00

Strategy Process Model
$3.00
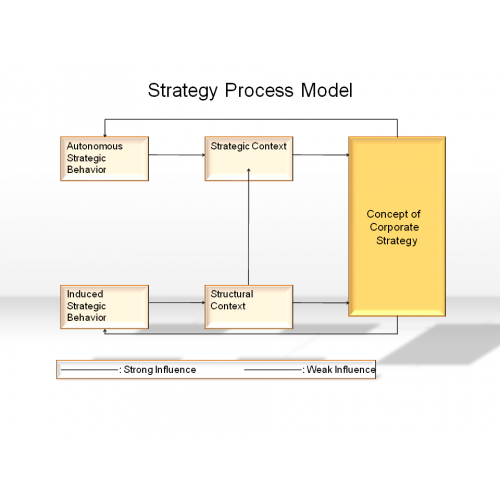
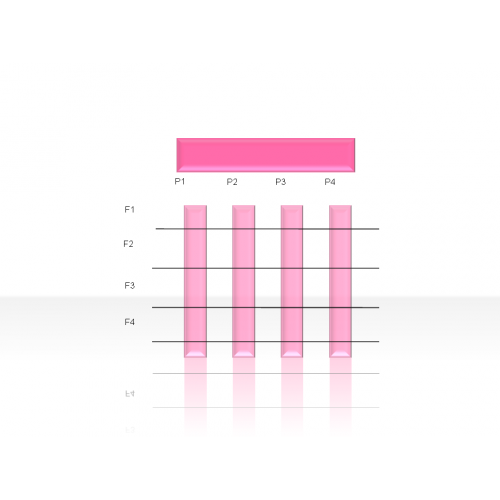
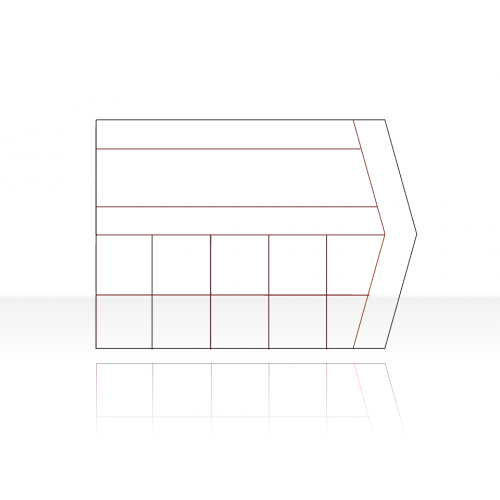
Table Diagrams 2.7.5
$2.00

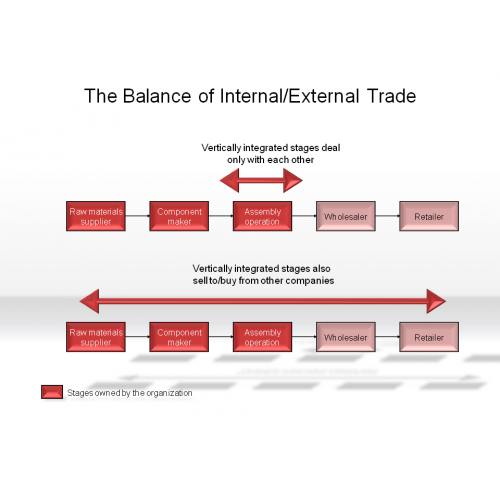
The Balance of Internal/External Trade
$3.00
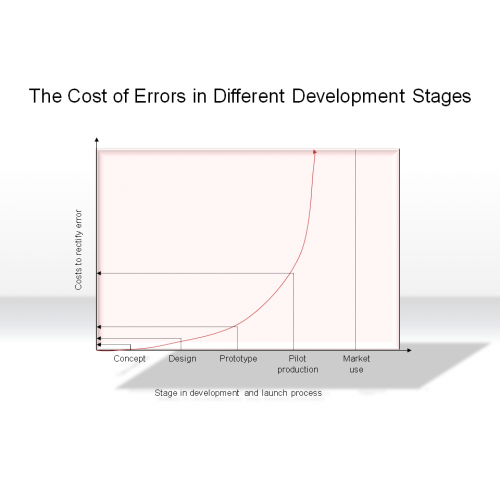
The Cost of Errors in Different Development Stages
$3.00
The Effects of a Tariff
$3.00

The Firm's Operating Cycle and it's Impact on the Firm's Balance Sheet
$3.00

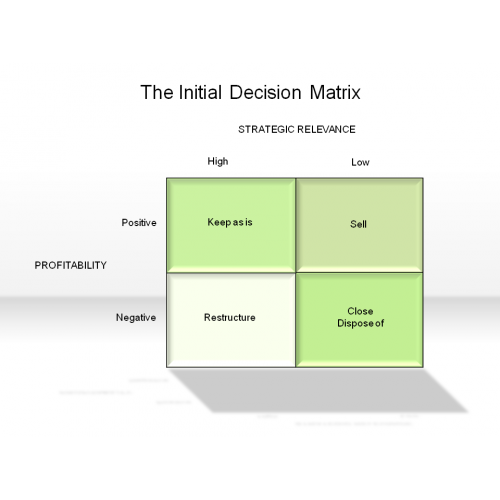
The Initial Decision Matrix
$3.00
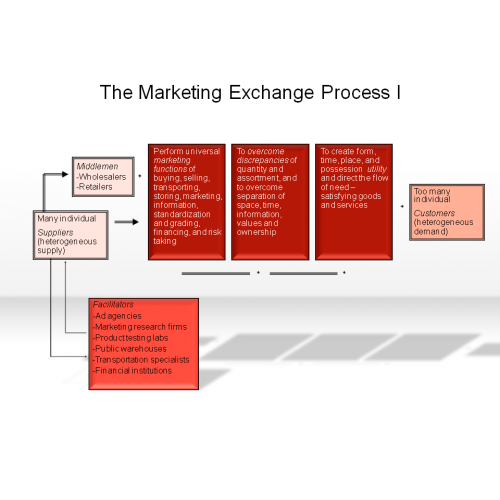
The Marketing Exchange Process I
$3.00
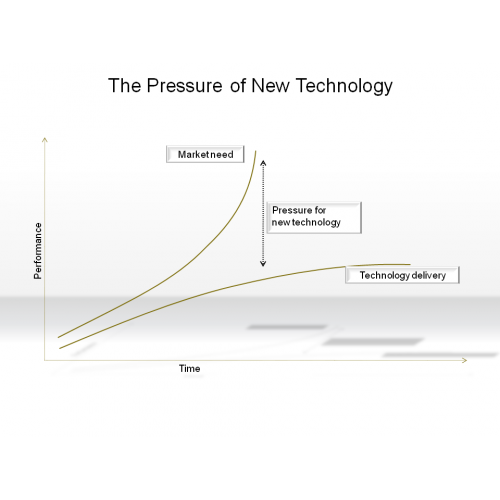
The Pressure of New Technology
$3.00
The Selling and Marketing Concepts
$3.00

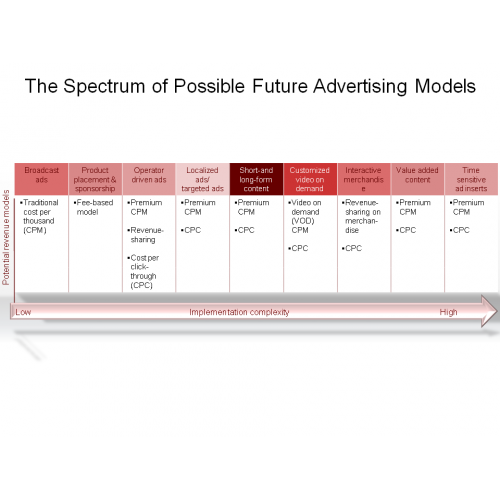
The Spectrum of Possible Future Advertising Models
$3.00
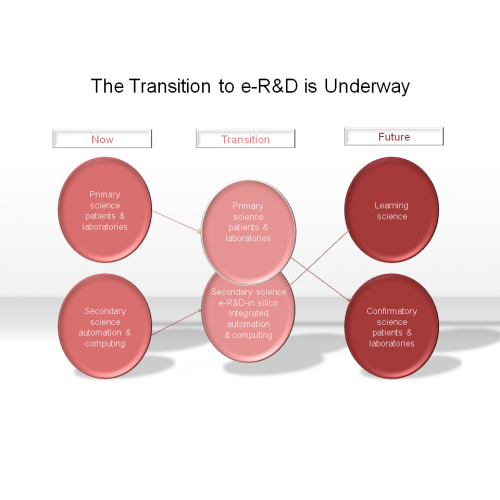
The Transition to e-R&D is Underway
$3.00
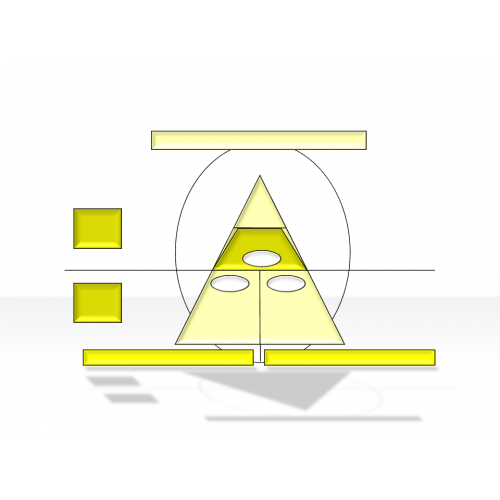
Triangle & Pyramids 2.3.1.5
$2.00

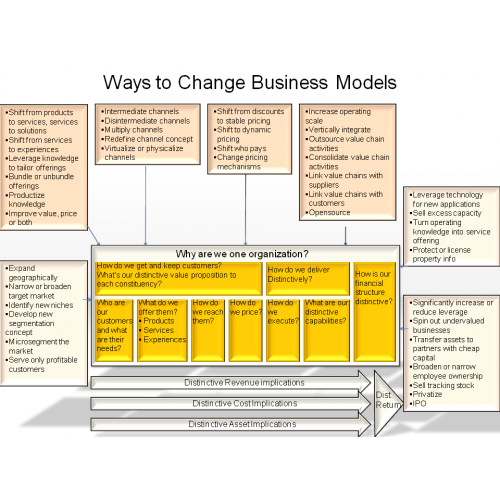
Ways to Change Business Models
$3.00
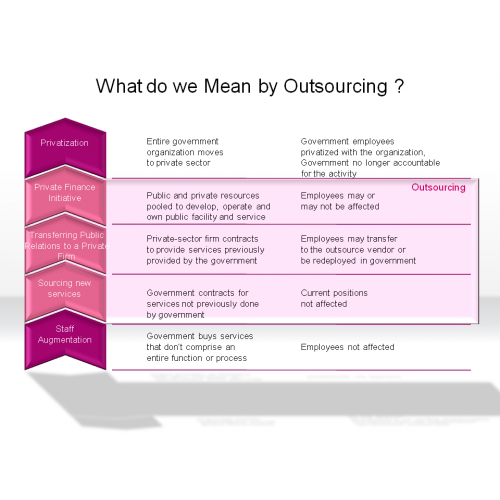
What do we Mean by Outsourcing ?
$3.00
2-Axis diagram 2.2.1.6
$2.00
4-Axis diagram 2.2.2.6
$2.00

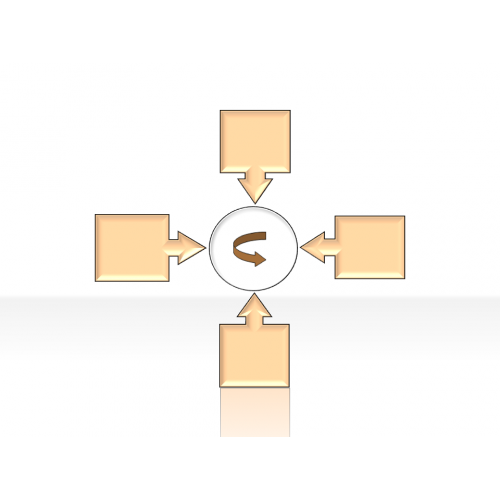
4-Field Matrix 2.4.1.6
$2.00
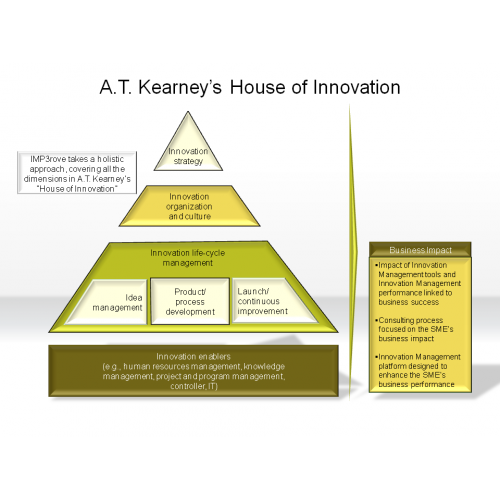
A.T.Kearney’s House of Innovation
$3.00
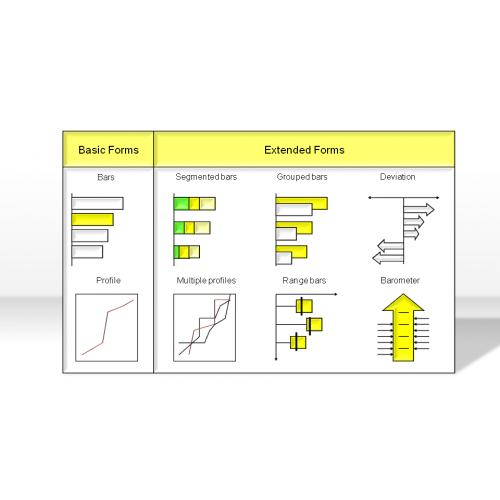
Bar diagram 2.2.3.6
$2.00

Basic Business Model 3.1.2.6
$2.00
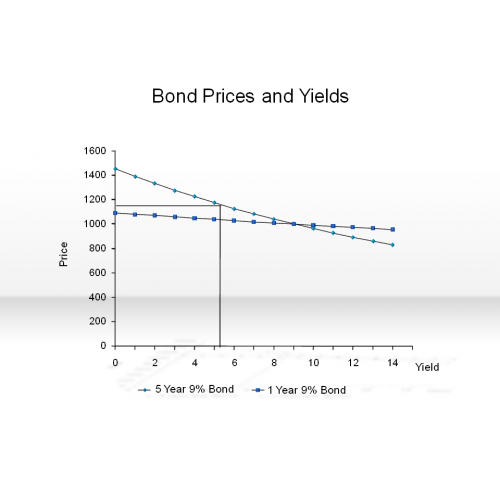
Bond Prices and Yields
$3.00
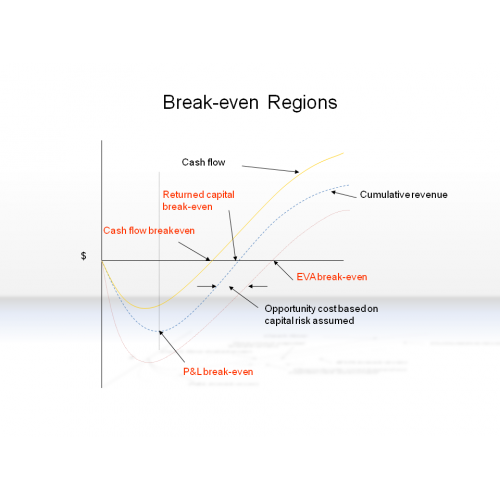
Break-even Regions
$3.00
business captain 4.3.1.6
$2.00

business champ 4.3.2.6
$2.00
business chief 4.3.3.6
$2.00
business chief 4.3.4.6
$2.00
business executive 4.3.5.6
$2.00
business expert 4.3.6.6
$2.00
business head 4.3.7.6
$2.00
business king 4.3.8.6
$2.00
business man 4.3.9.6
$2.00
business master 4.3.10.6
$2.00
business one 4.3.11.6
$2.00
business power 4.3.12.6
$2.00
business principle 4.3.13.6
$2.00
business star 4.3.14.6
$2.00
business success 4.3.15.6
$2.00
Changes in the Clinical Process will Reflect the New Technology
$3.00

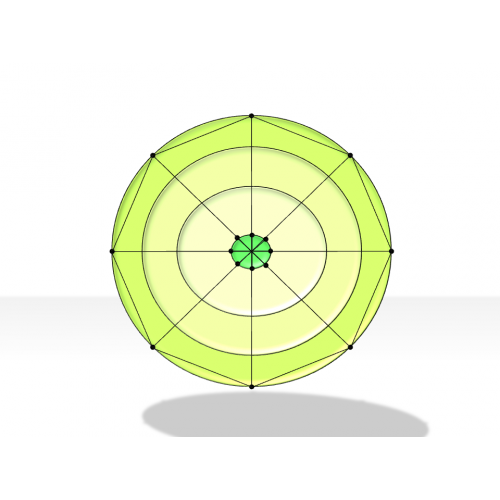
Circle Diagram 2.3.2.6
$2.00

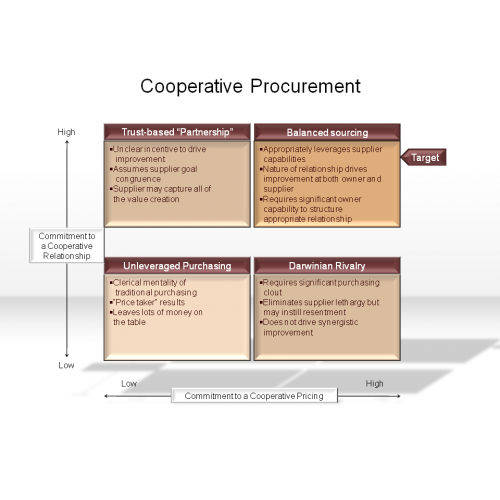
Cooperative Procurement
$3.00
Cross Diagram 2.3.3.6
$2.00
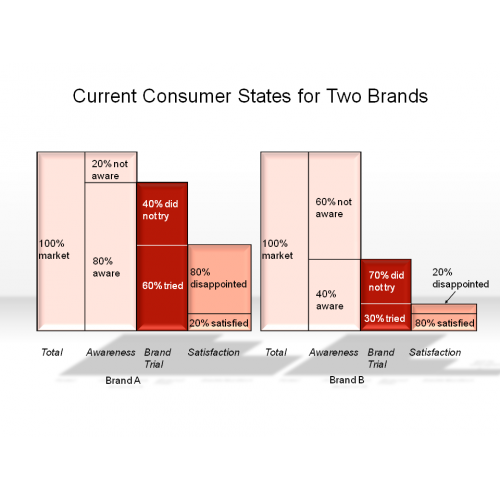
Current Consumer States for Two Brands
$3.00
Curve Diagram 2.2.5.6
$2.00
cycle diagram 2.1.2.6
$2.00

Degree of market regulation and relative importance of strategy
$3.00

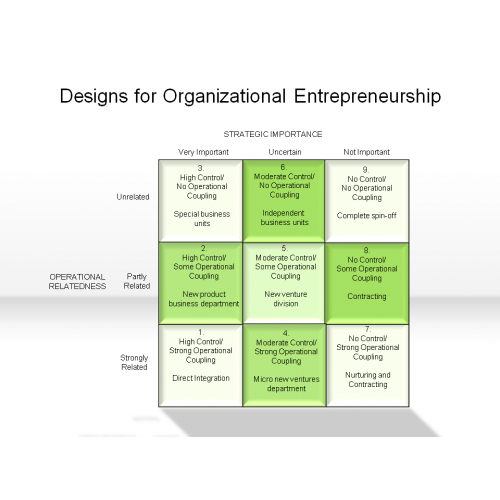
Designs for Organizational Entrepreneurship
$3.00
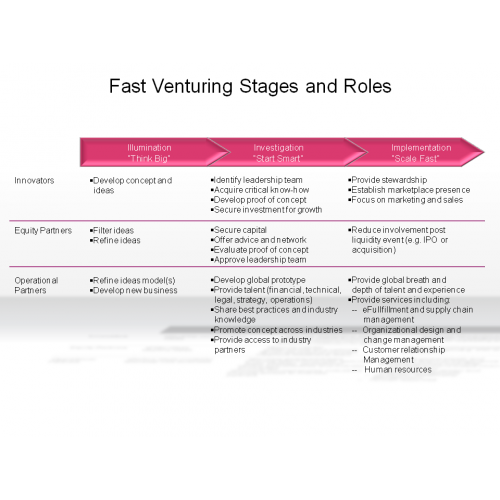
Fast Venturing Stages and Roles
$3.00
flow diagram 2.1.1.6
$2.00


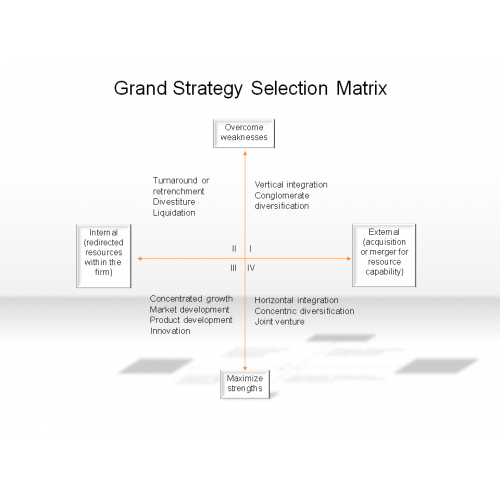
Grand Strategy Selection Matrix
$3.00
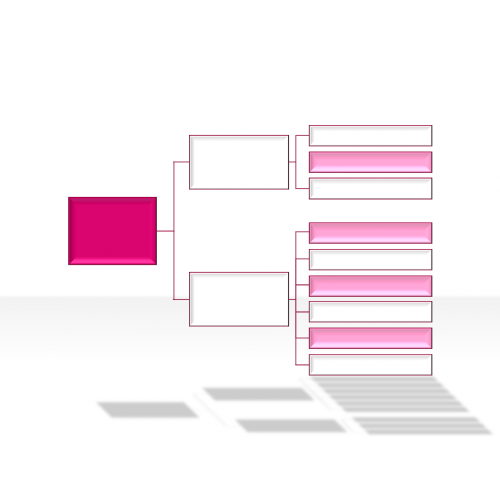
Hierarchy Diagrams 2.6.6
$2.00
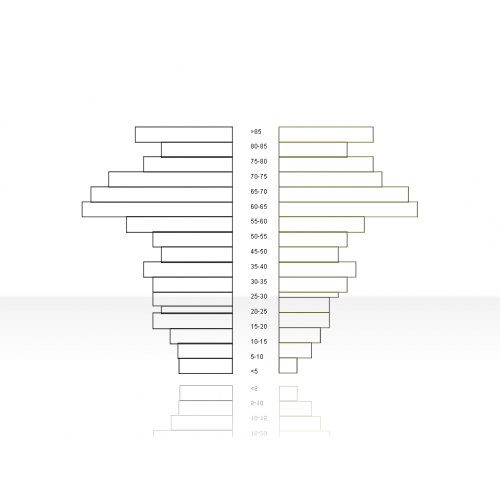
Histogram 2.2.4.6
$2.00
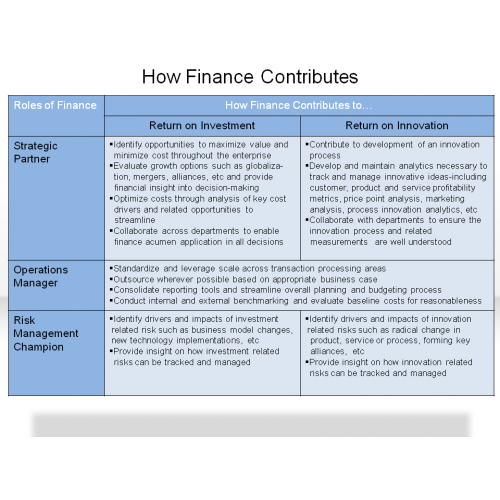
How Finance Contributes
$3.00
Increasing Scope & Complexity Make Outsourcing More Challenging
$3.00

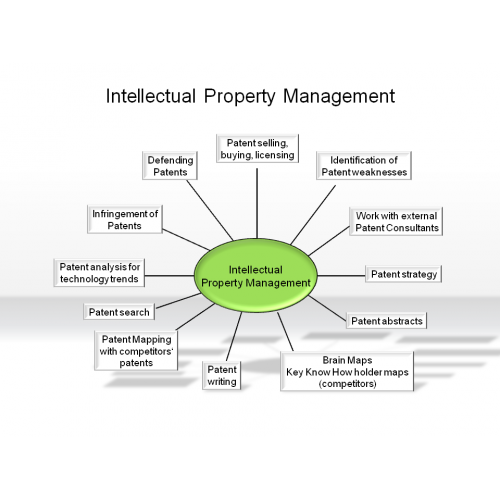
Intelectual Property Management
$3.00
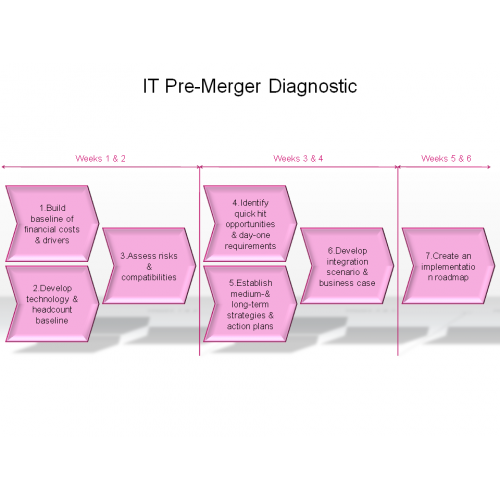
IT Pre-Merger Diagnostic
$3.00
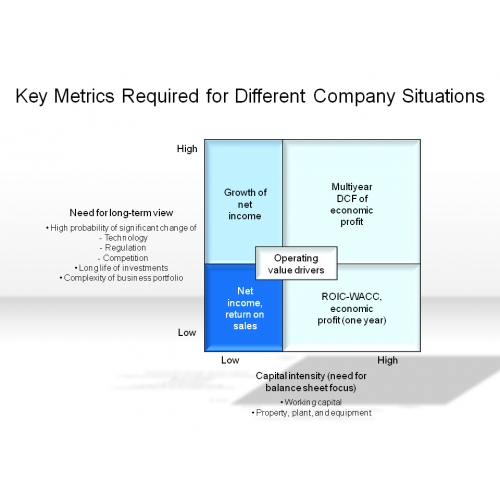
Key Metrics Required for Different Company Situations
$3.00
Line Diagram 2.2.6.6
$2.00

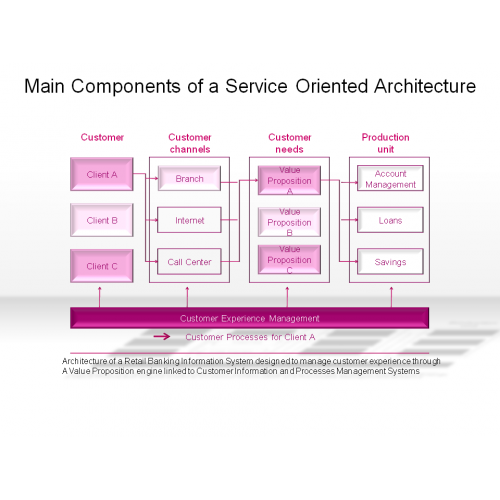
Main Components of a Service Oriented Architecture
$3.00
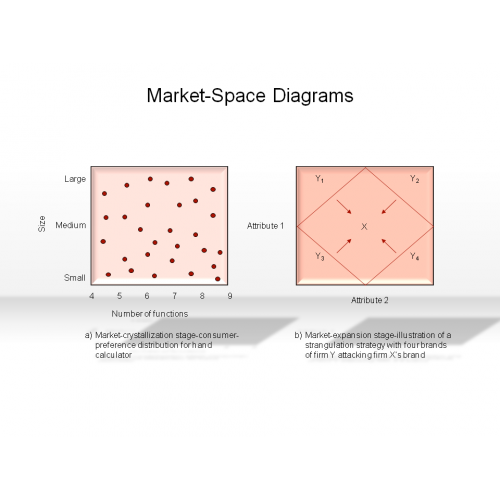
Market-Space Diagrams
$3.00
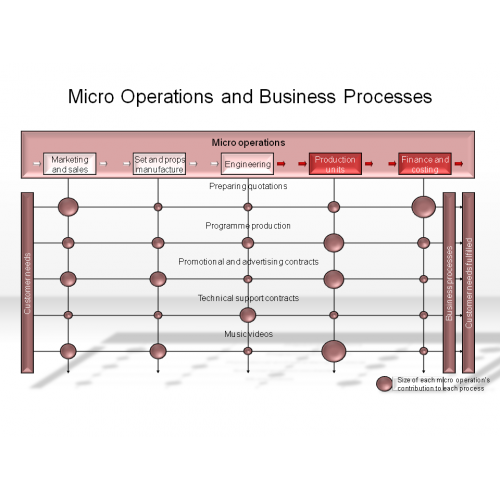
Micro Operations and Business Processes
$3.00
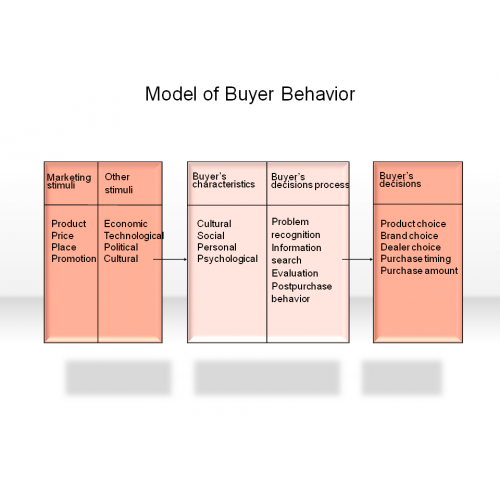
Model of Buyer Behavior
$3.00
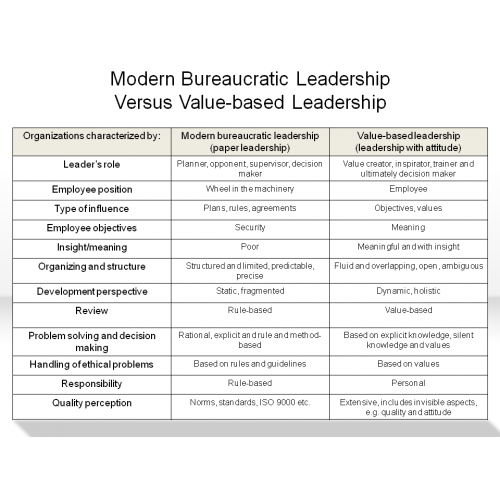
Modern Bureaucratic Leadership Versus Value-based Leadership
$3.00
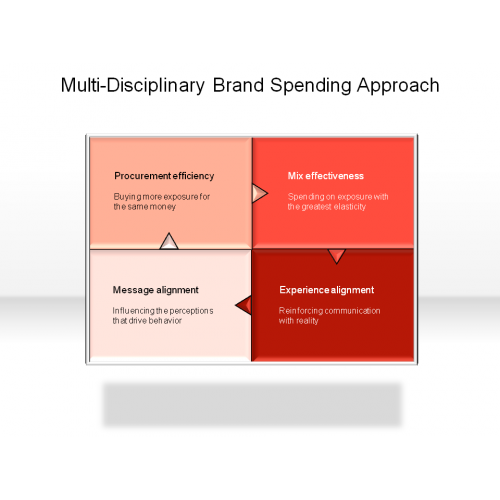
Multi-Disciplinary Brand Spending Approach
$3.00
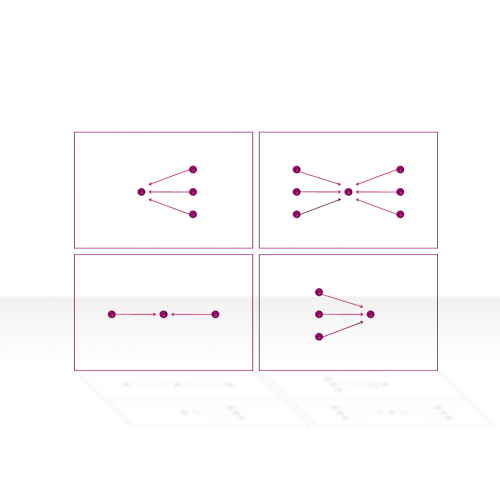
network diagram 2.1.3.6
$2.00
Organization Matrix 2.4.3.6
$2.00
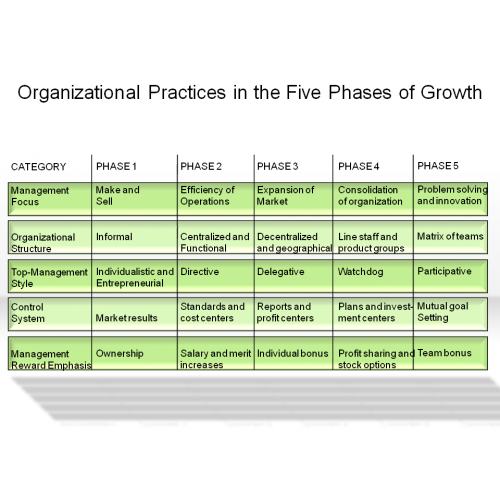
Organizational Practices in the Five Phases of Growth
$3.00
Portfolio Position and Defensive Strategic Market Plans
$3.00

process diagram 2.1.4.6
$2.00
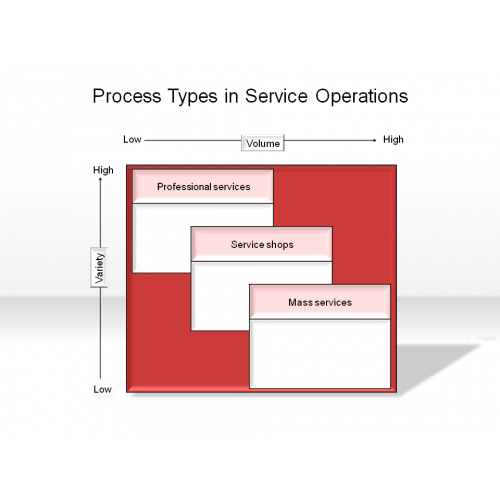
Process Types in Service Operations
$3.00
Set & Subset Diagram 2.3.4.6
$2.00
Skim Pricing
$3.00

Sources of Cash Inflow and Cash Outflow
$3.00

Square & Cubes 2.3.6.6
$2.00

Stars & Comb Diagram 2.3.5.6
$2.00
